ANTI-HERO Dashboard
Watch, break and measure a distributed system in real time
Launch Live Demo Original ANTI-HERO project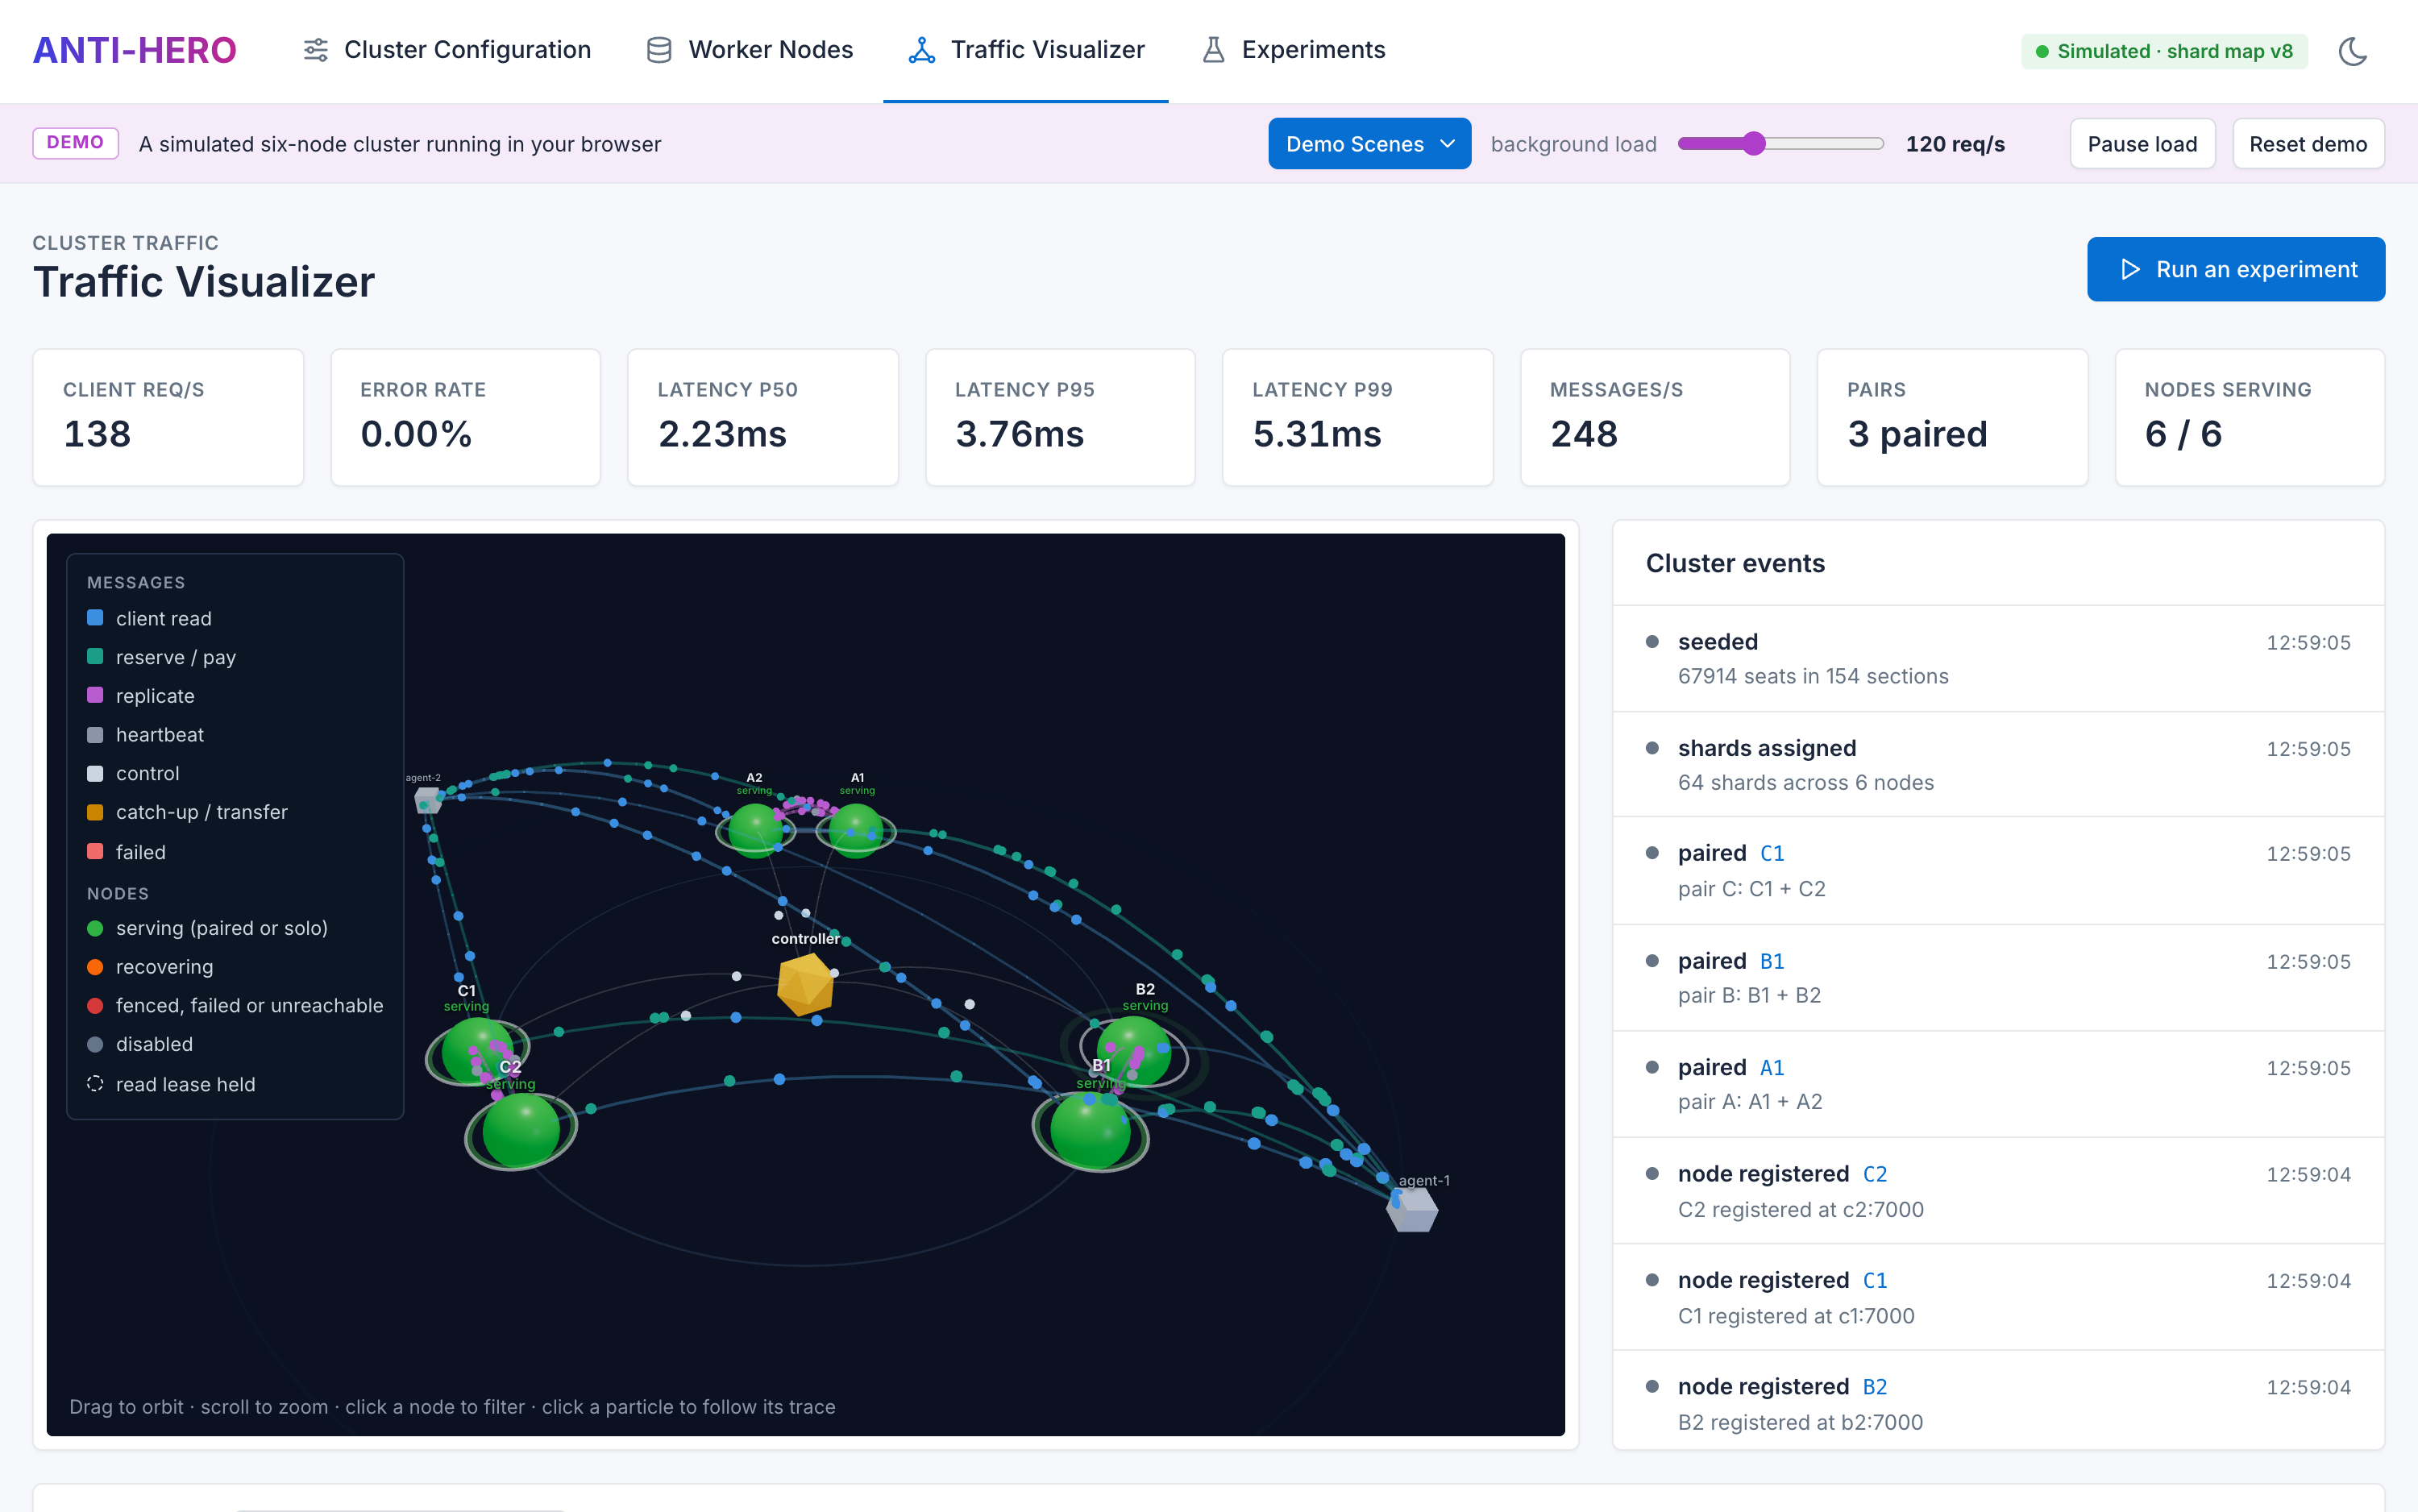
Real-time
A single WebSocket stream drives the 3D view, KPIs and charts, updating every frame as the cluster changes.
Hands-on
Crash nodes, partition pairs and move shards on purpose, then watch the cluster fail over and heal itself.
Measurable
Every experiment ends with throughput, latency, recovery time and correctness checks you can compare and replay.
- React
- TypeScript
- Vite
- Three.js
- D3.js
- TanStack Query
- Zustand
- Python
- FastAPI
- gRPC
- SQLite
- Docker
- Nginx
- GitHub Actions
Watch it, break it, measure it
Traffic Visualizer
See every message cross the cluster
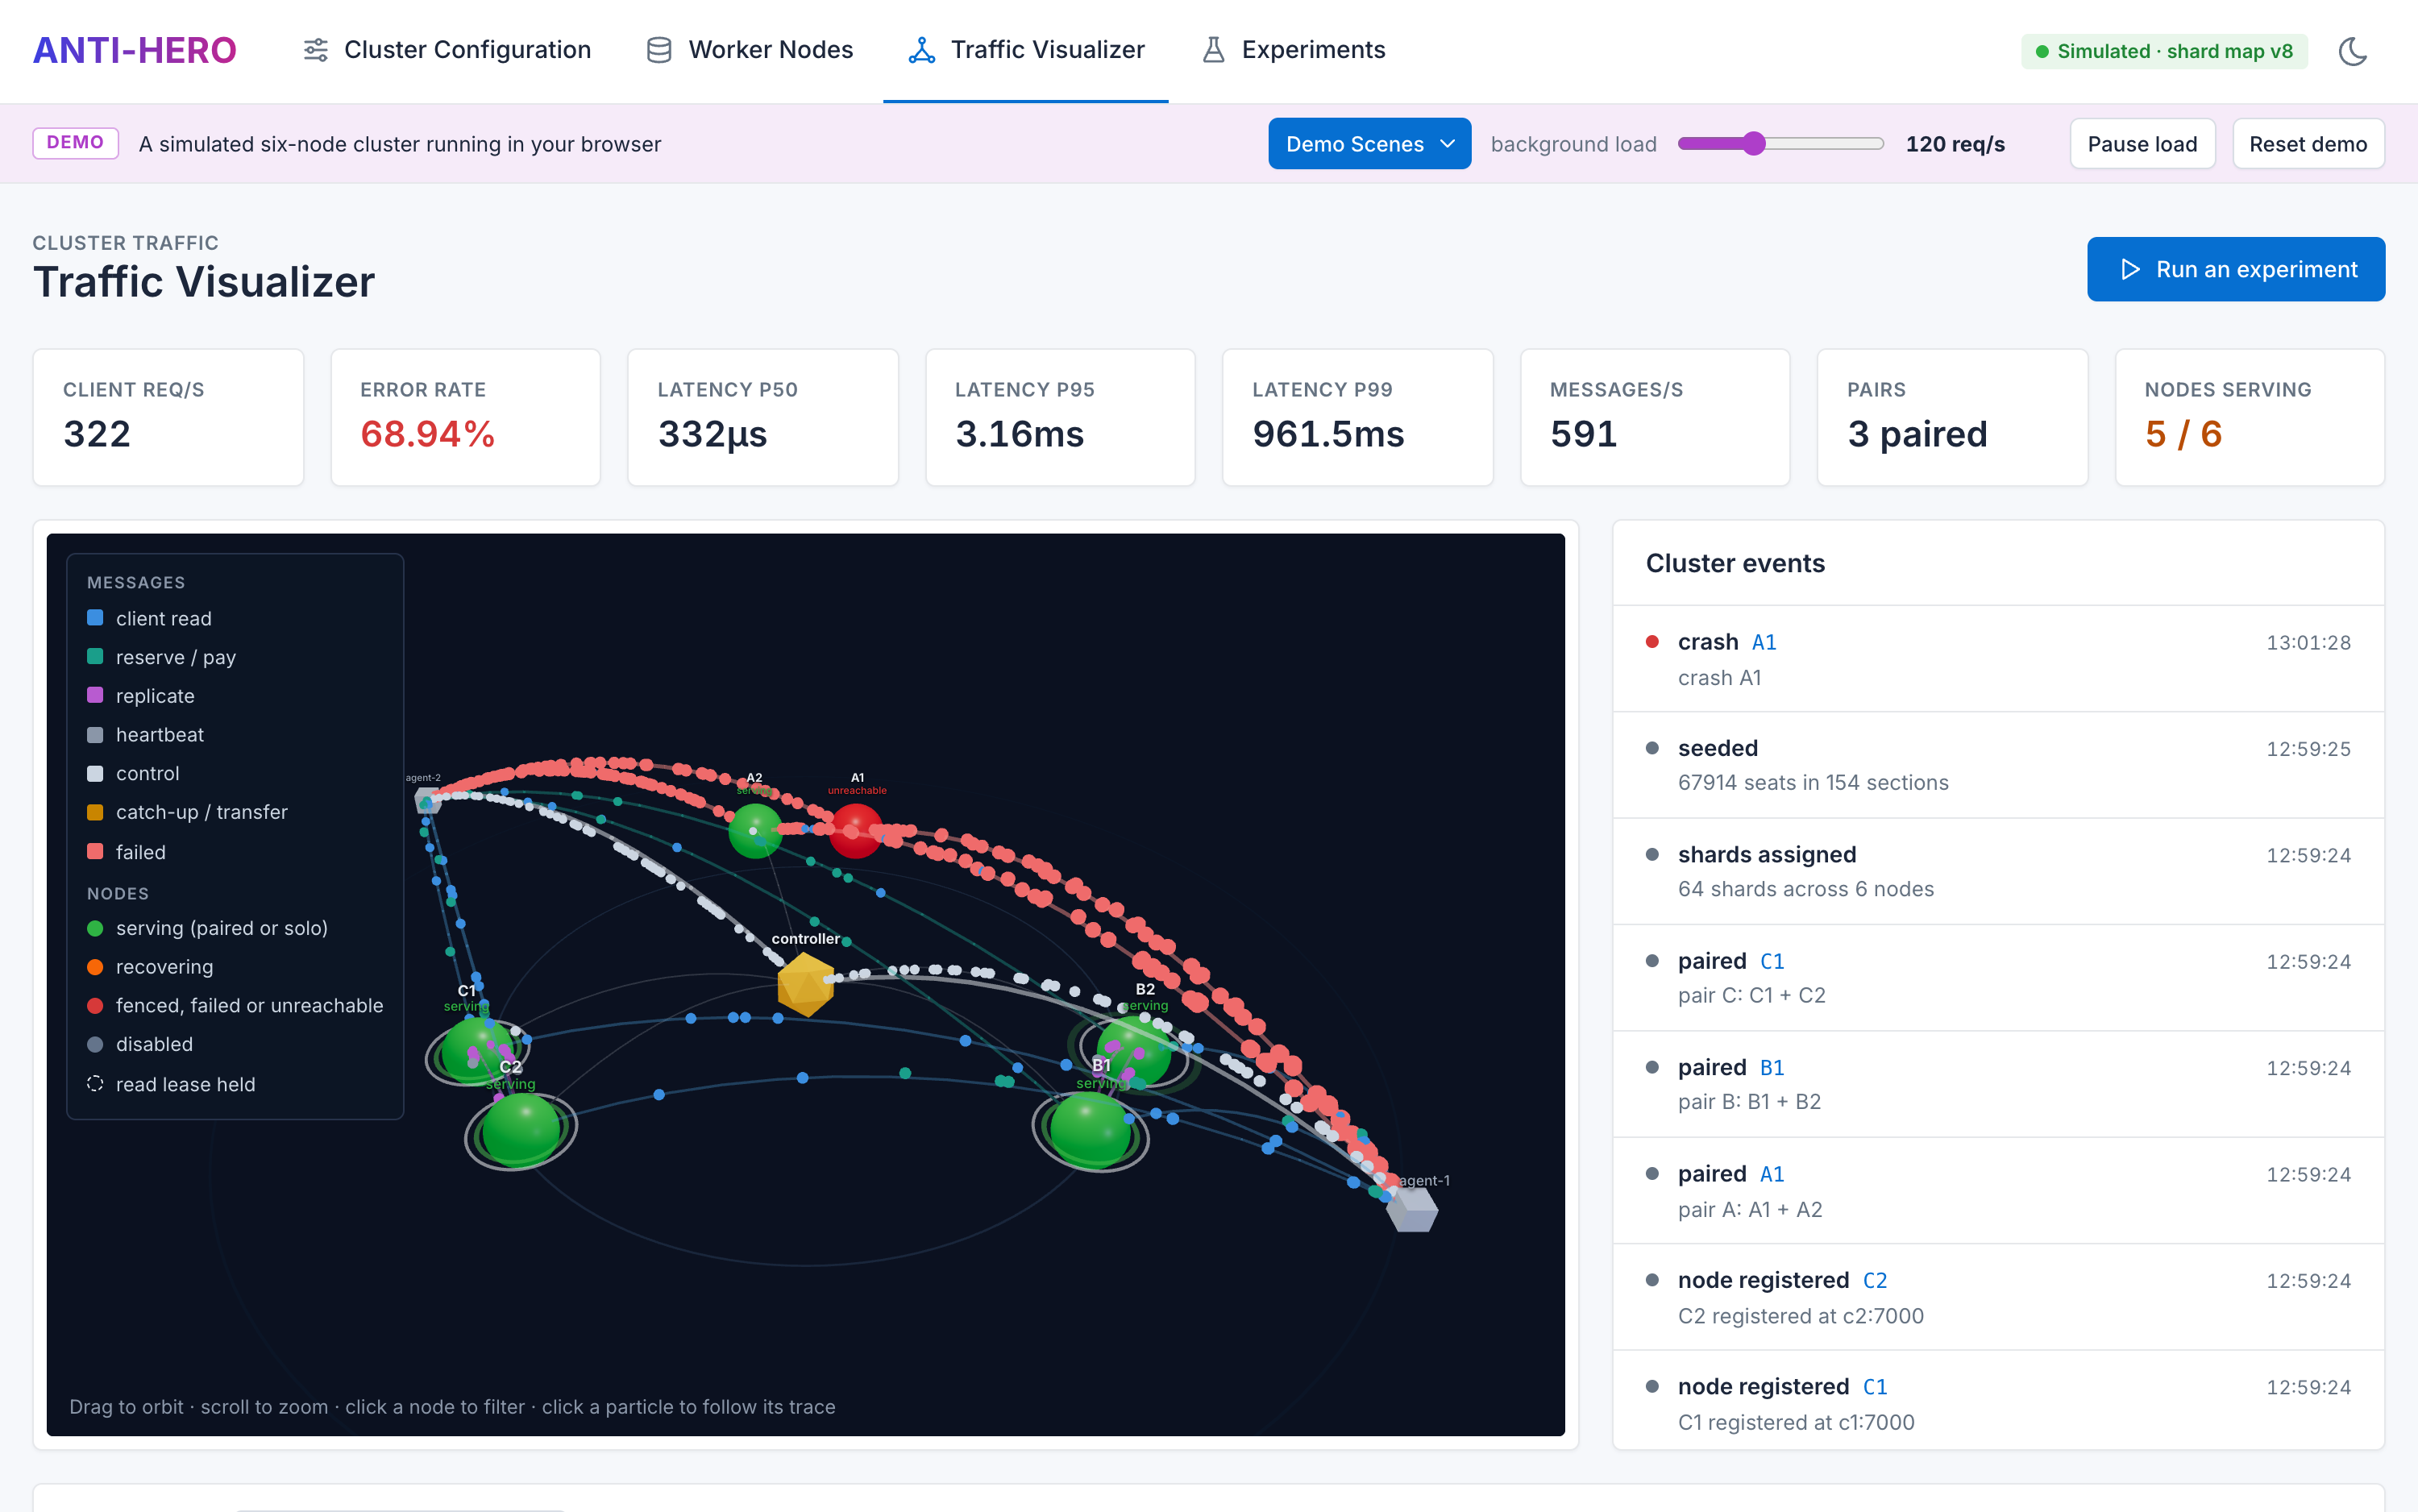
The controller sits at the center with each primary/backup pair on a ring around it. Every sampled message flies along its own arc, colored by type and turning red on failure, while nodes change color with their state and grow with the shards they own. Click a node to filter the charts, or a particle to trace its hops.
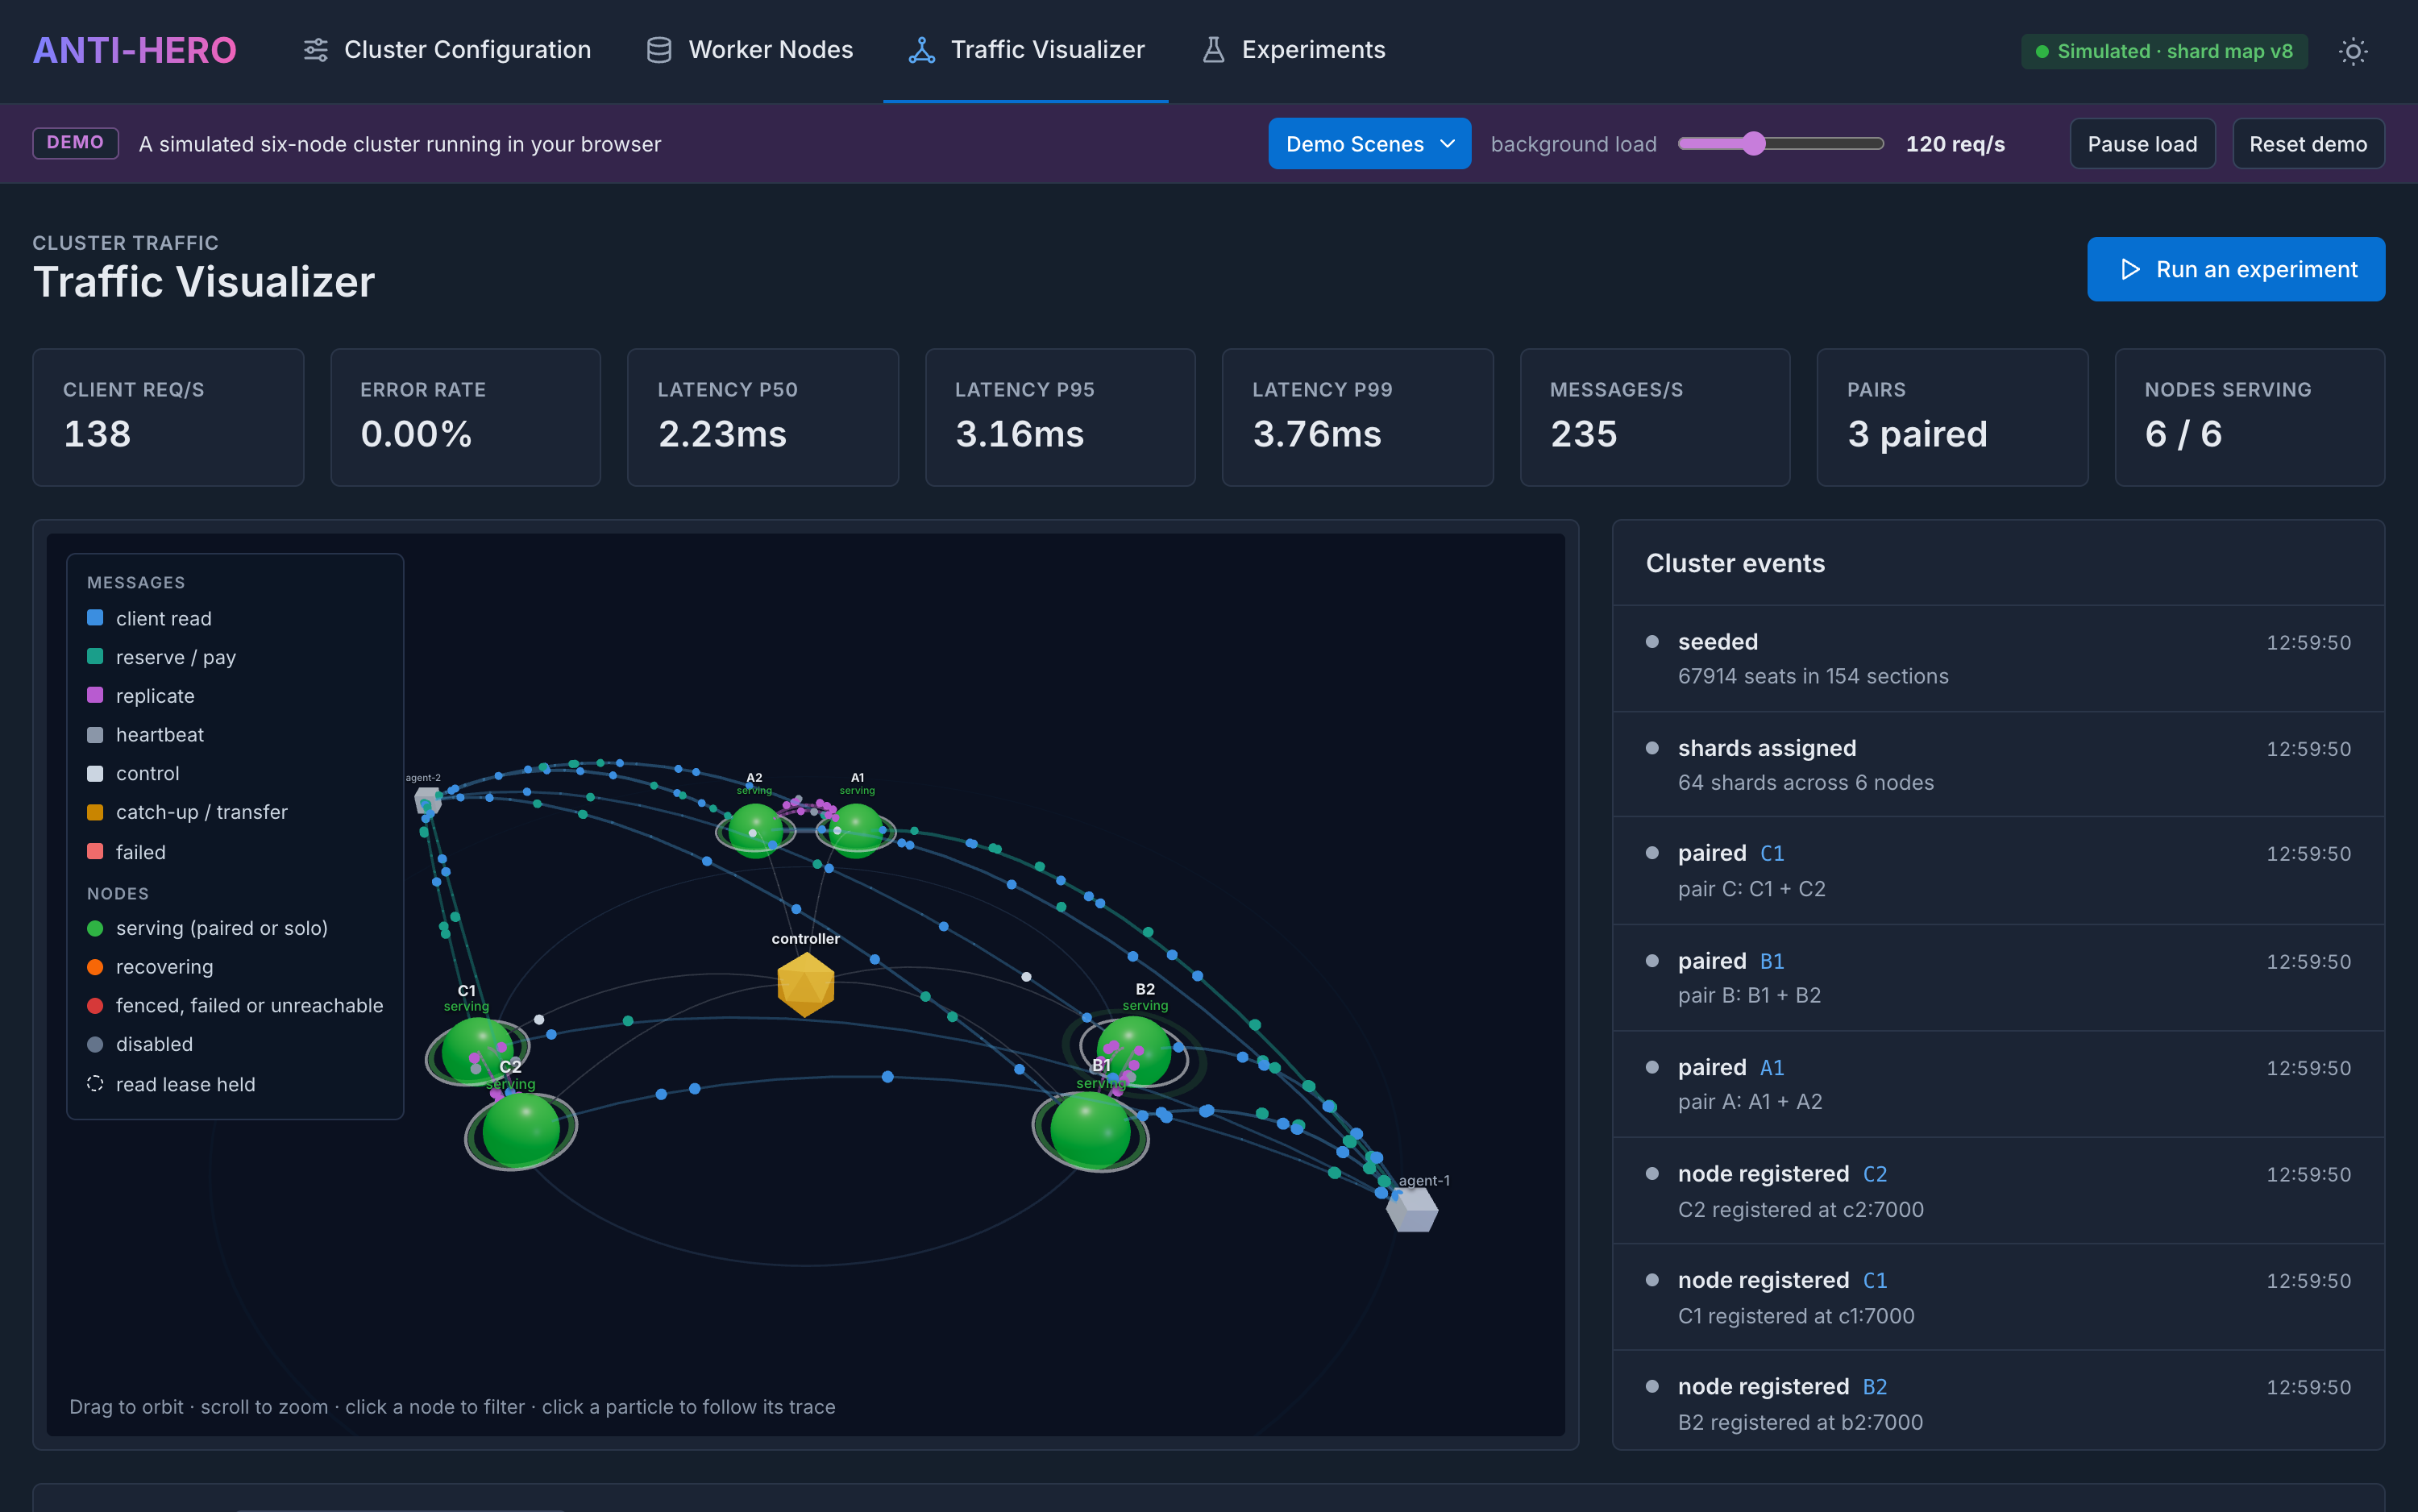
Light and dark themes
Switch themes from the header. The choice is remembered and applied before the first paint.
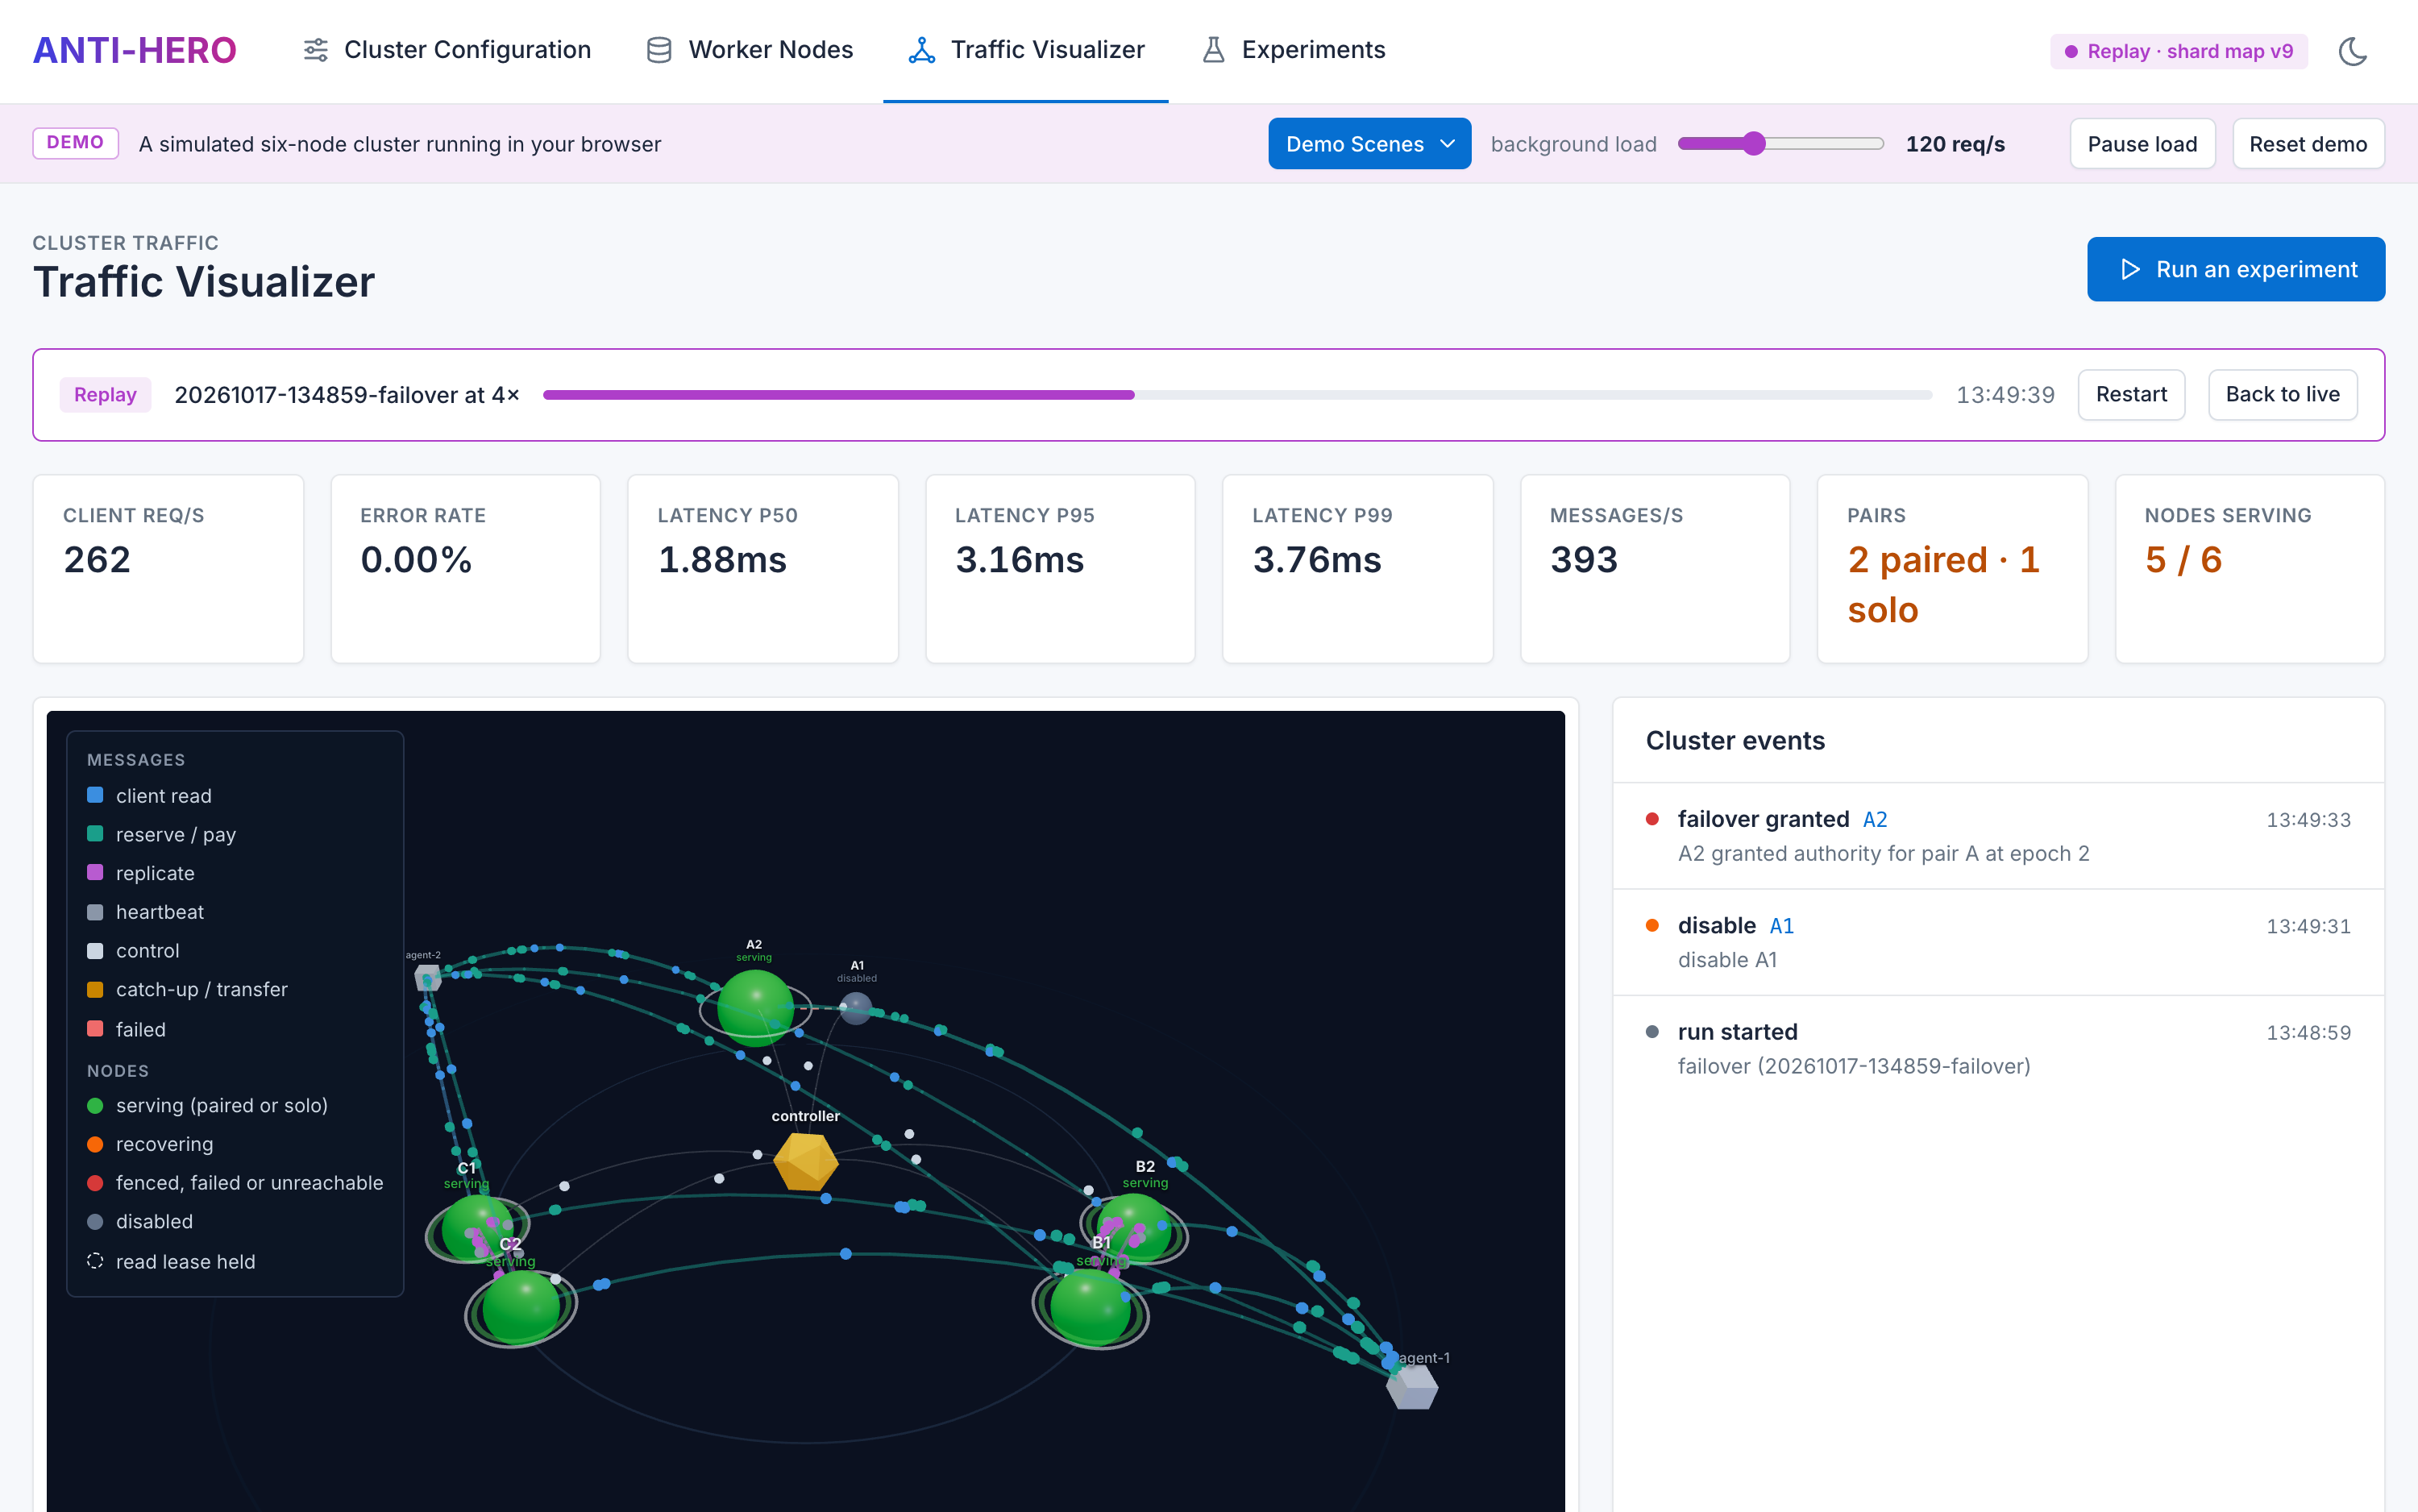
Replay any run
Recorded runs play back through the same view at speed, with a progress bar and cluster events as they happened.
Live Metrics
Know exactly what happened, and when
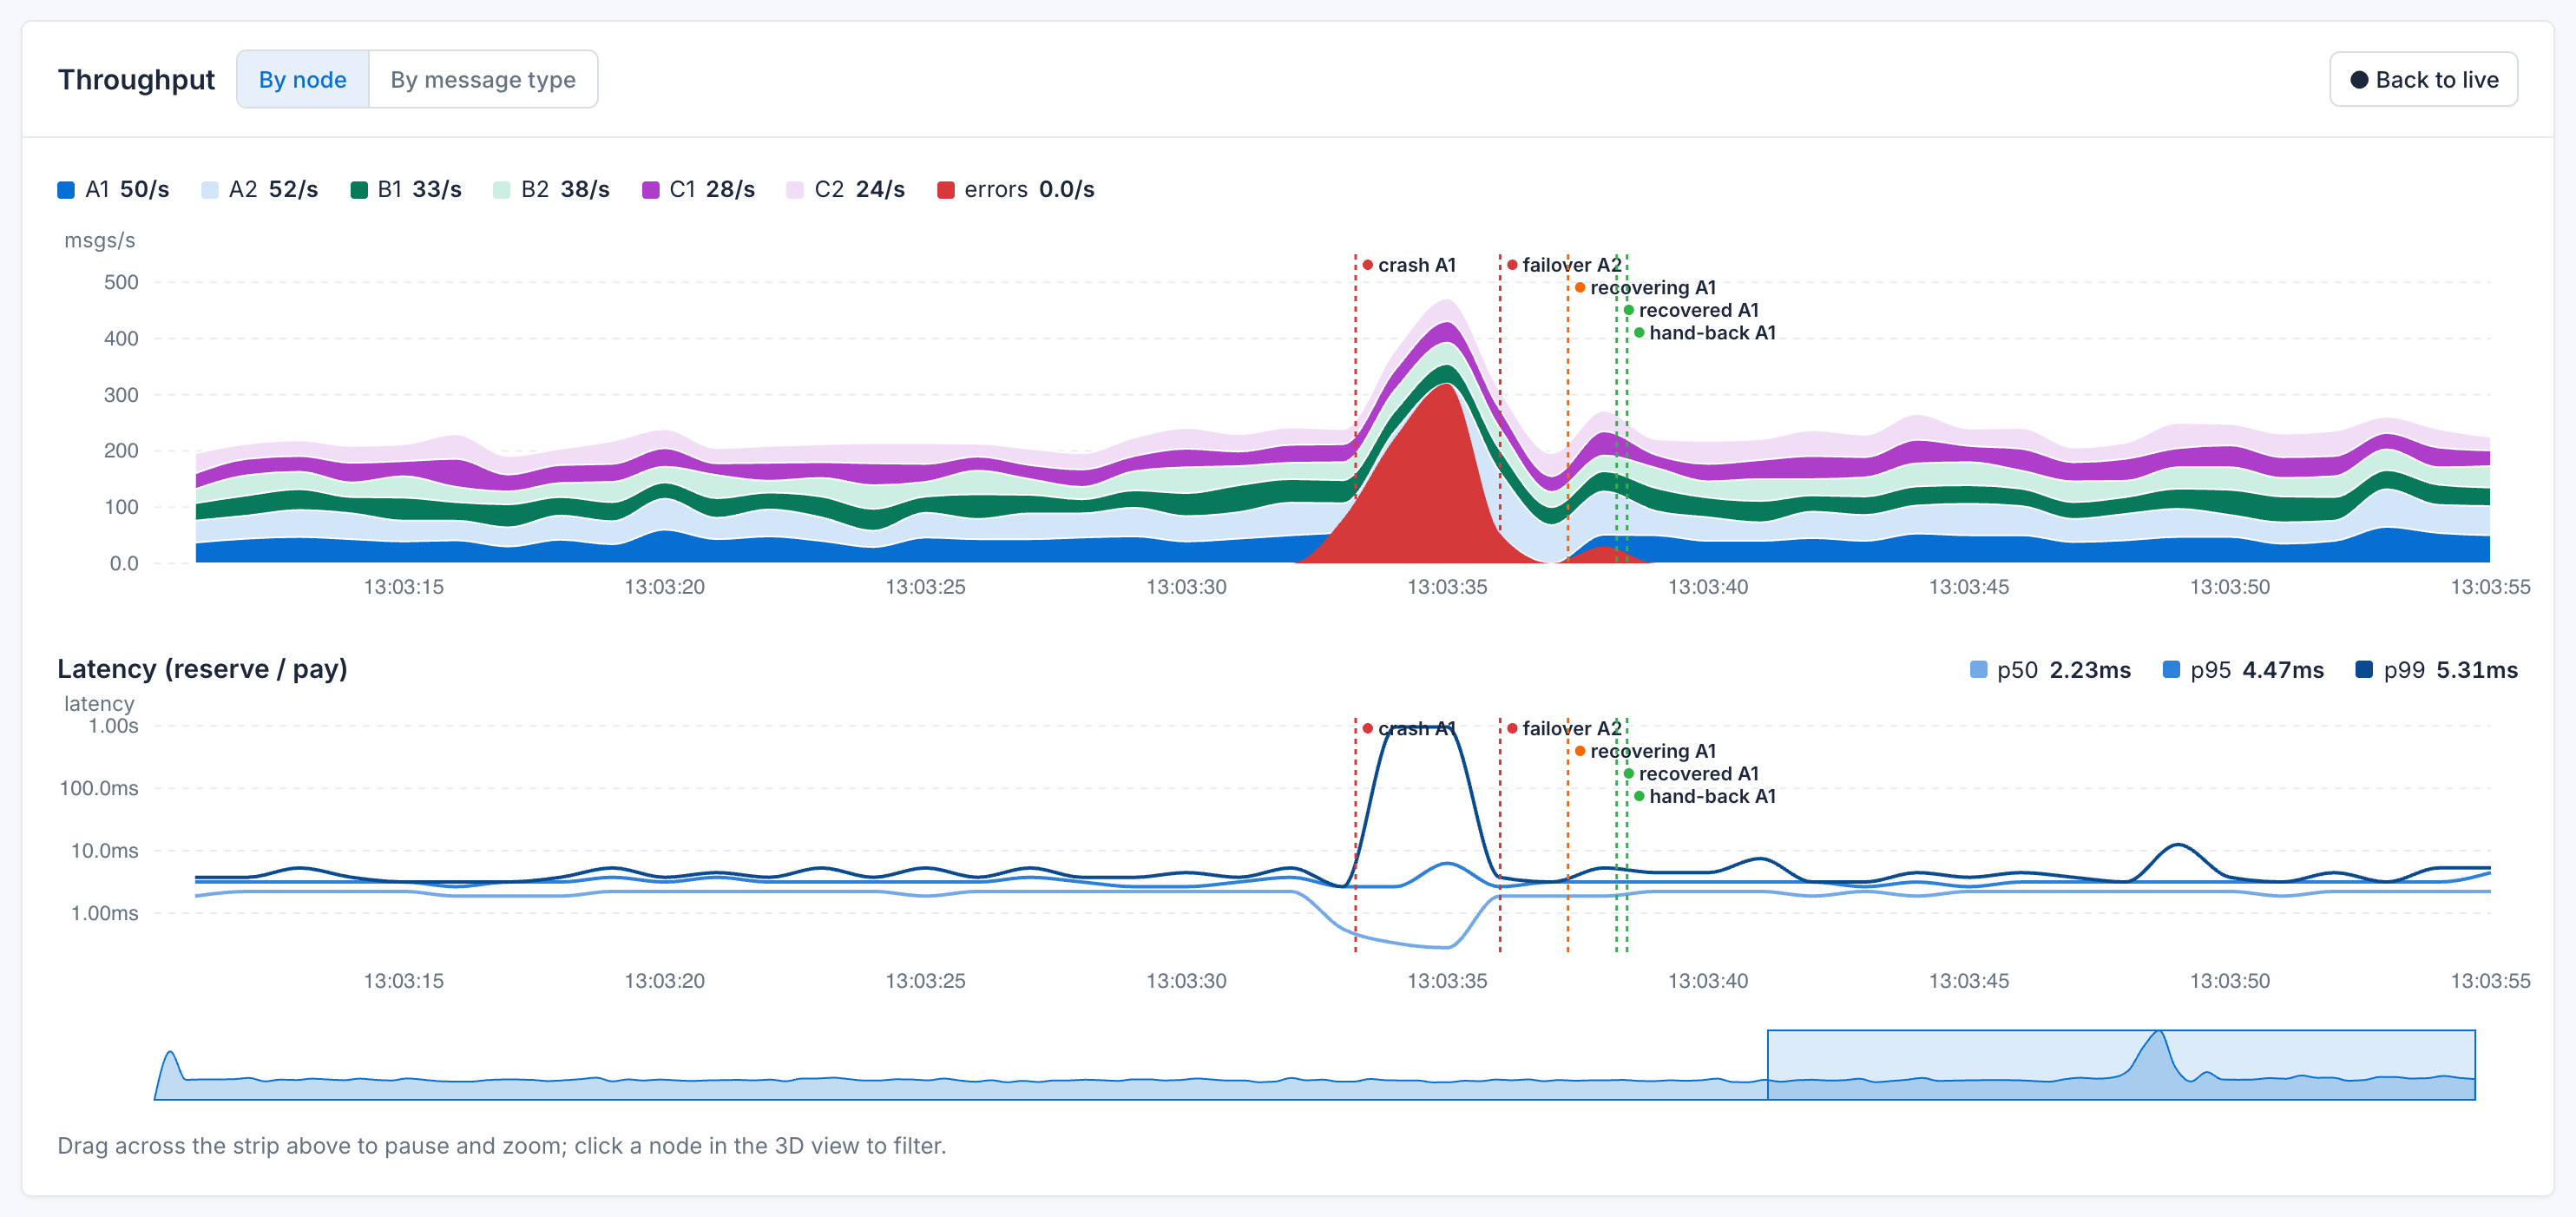
A KPI strip tracks client requests, error rate, latency percentiles and pair health. Below it, stacked throughput by node or message type sits above a log-scale latency chart, with every crash, failover and recovery drawn as a labelled marker. Drag across the overview strip to pause and zoom into any moment.
Cluster Configuration
The whole cluster on one page
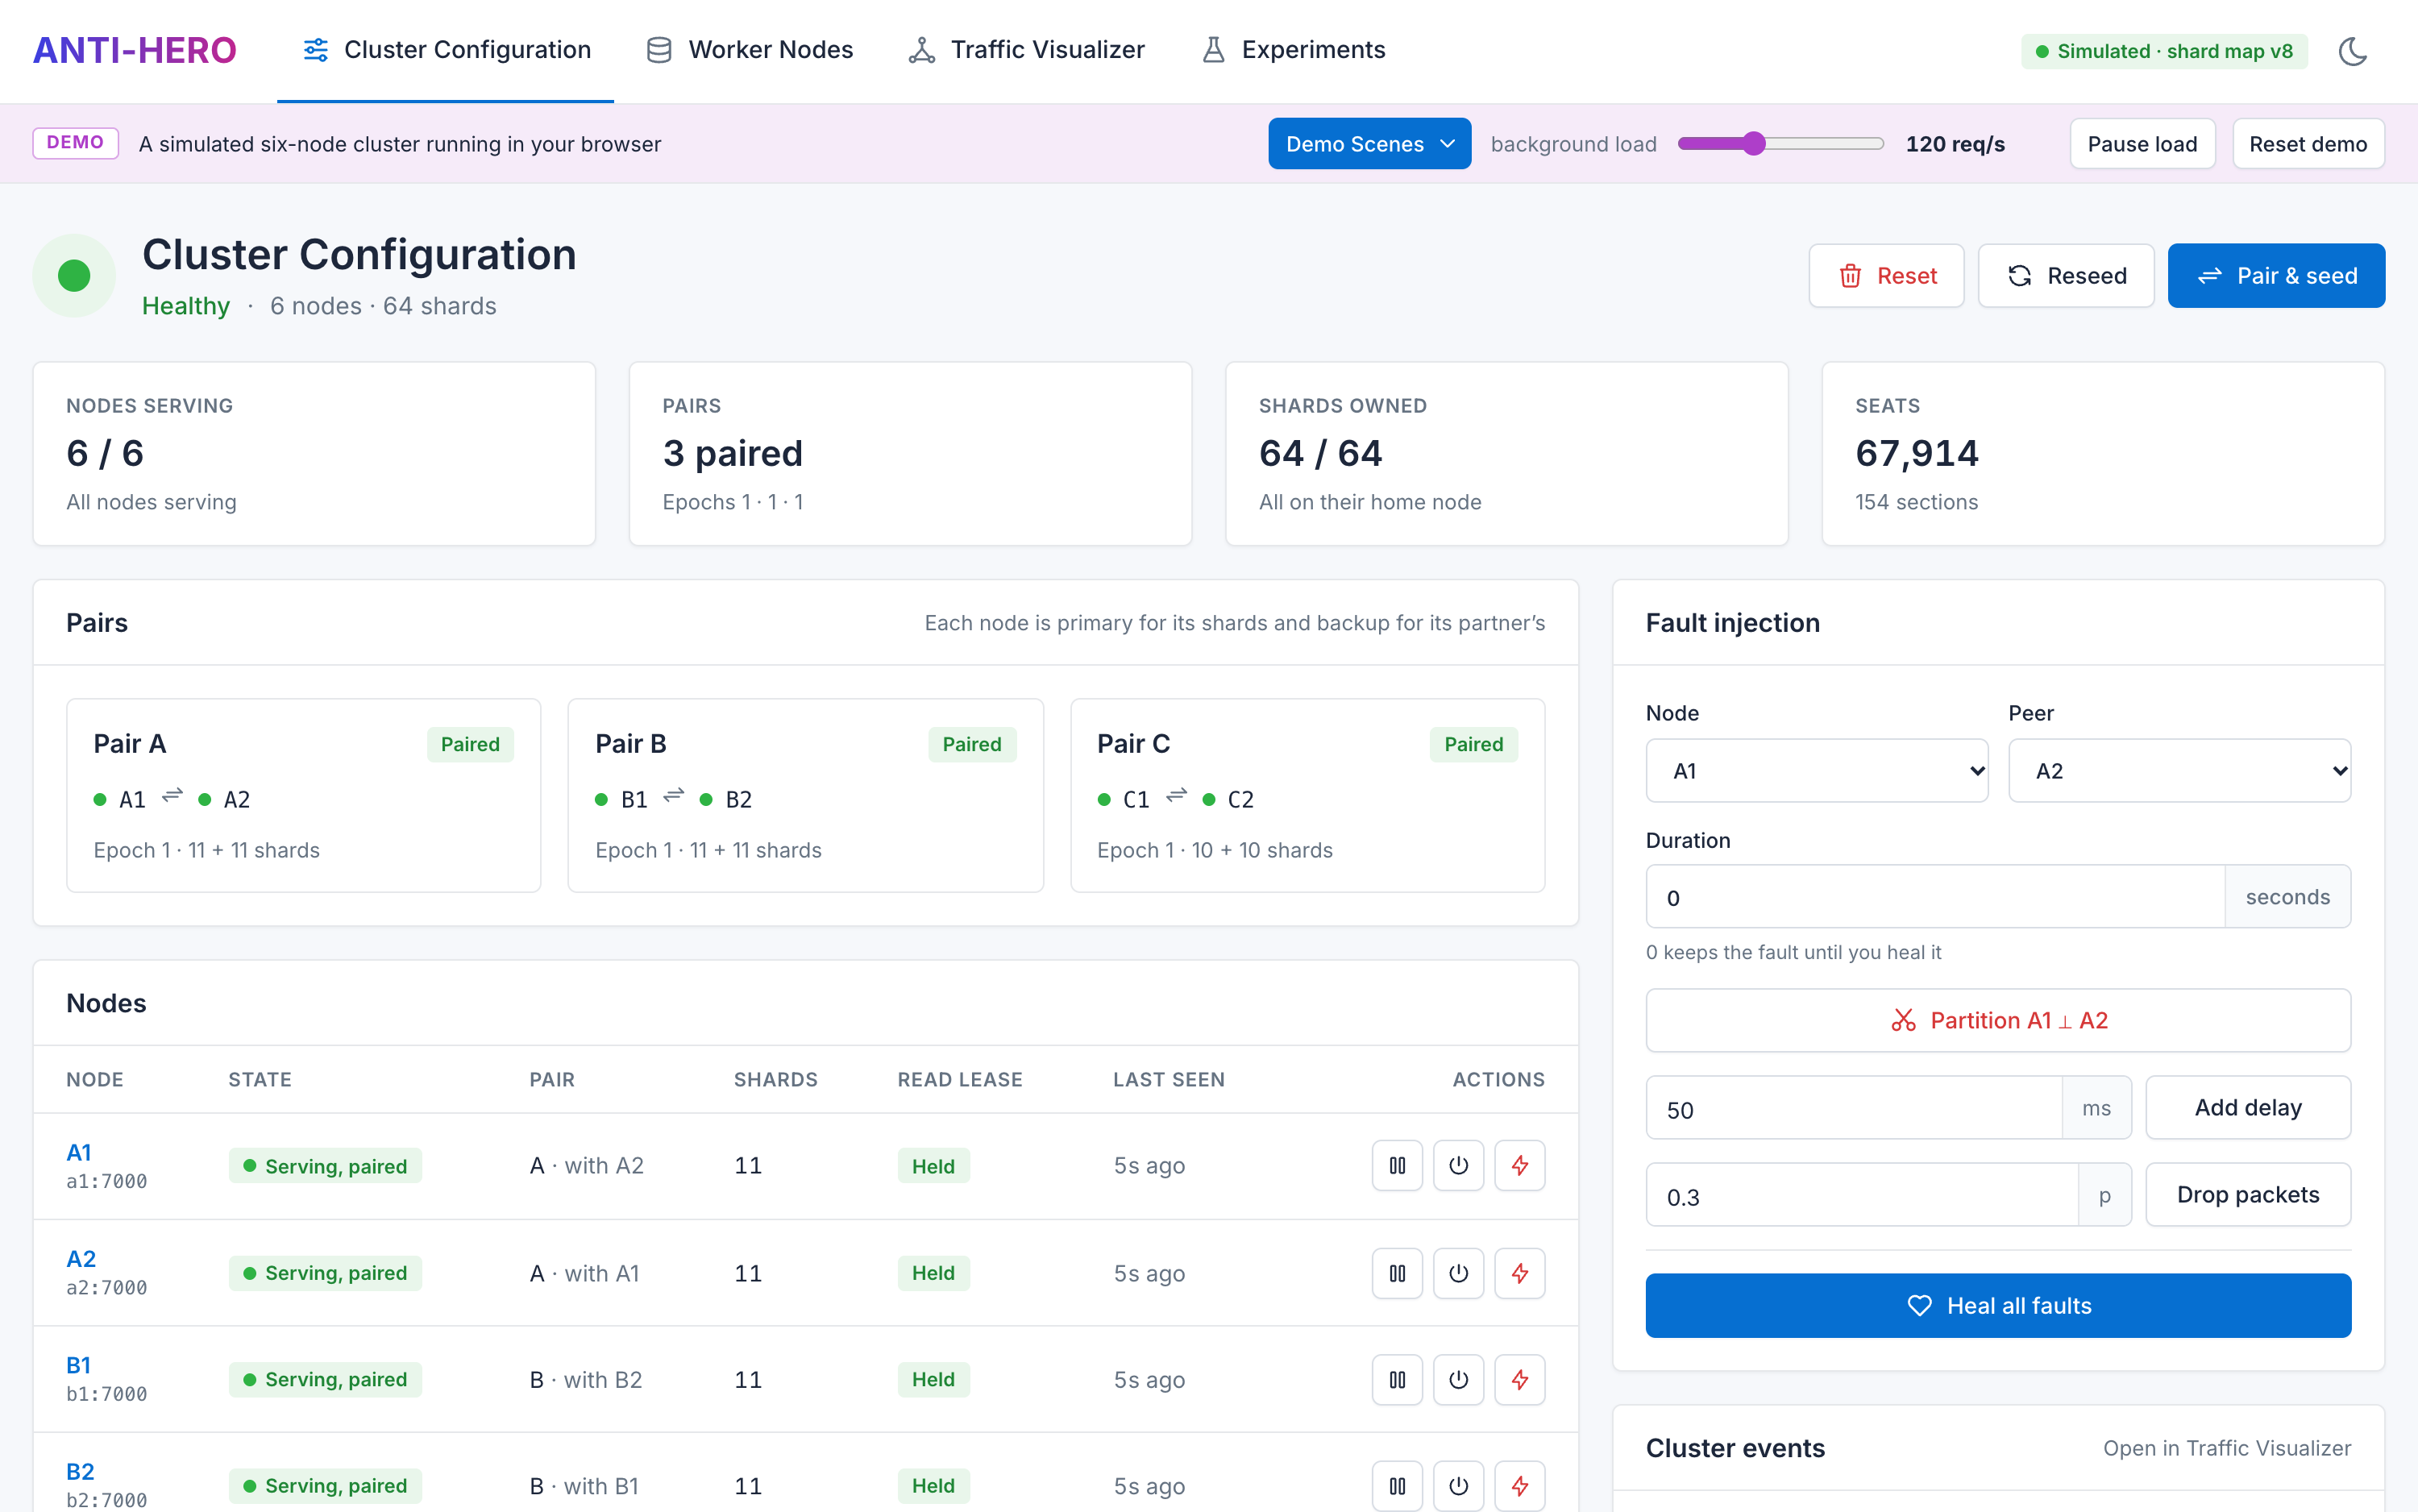
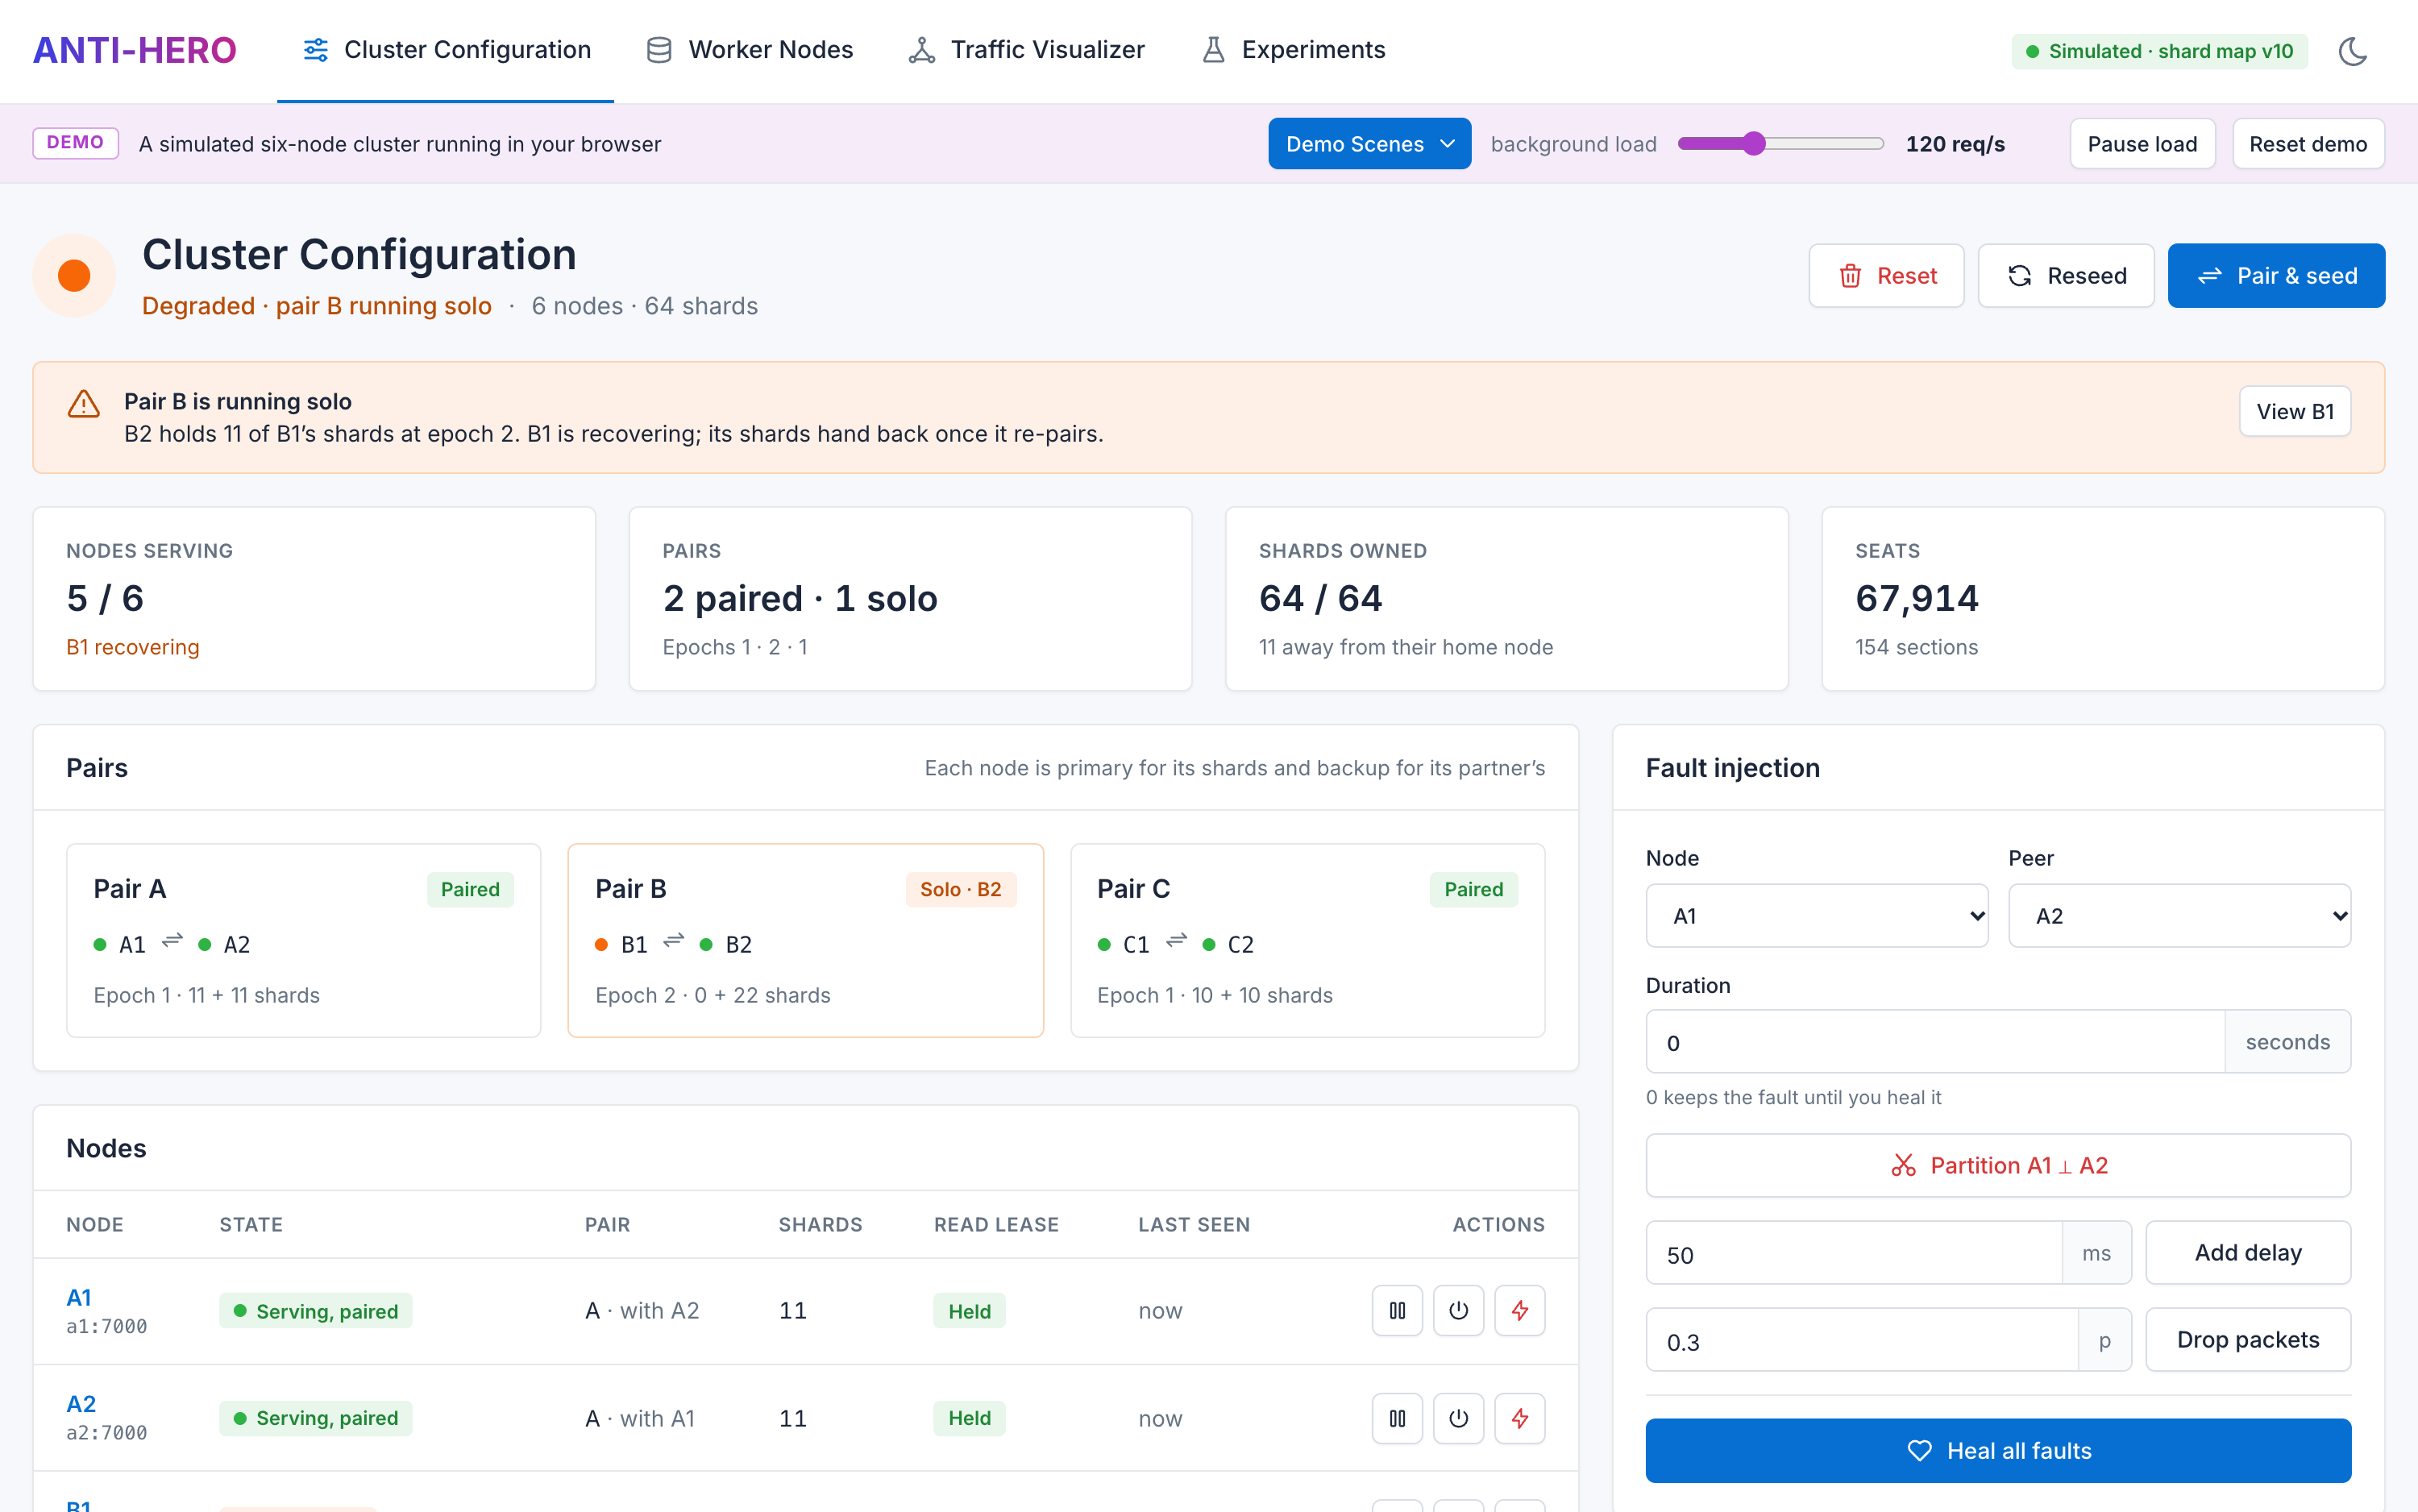
A status header shows whether the cluster is healthy, degraded or down. Pair tiles show each pair's members and epoch, and stat cards cover nodes serving, shard ownership and seat inventory.
Drag-and-drop shard map
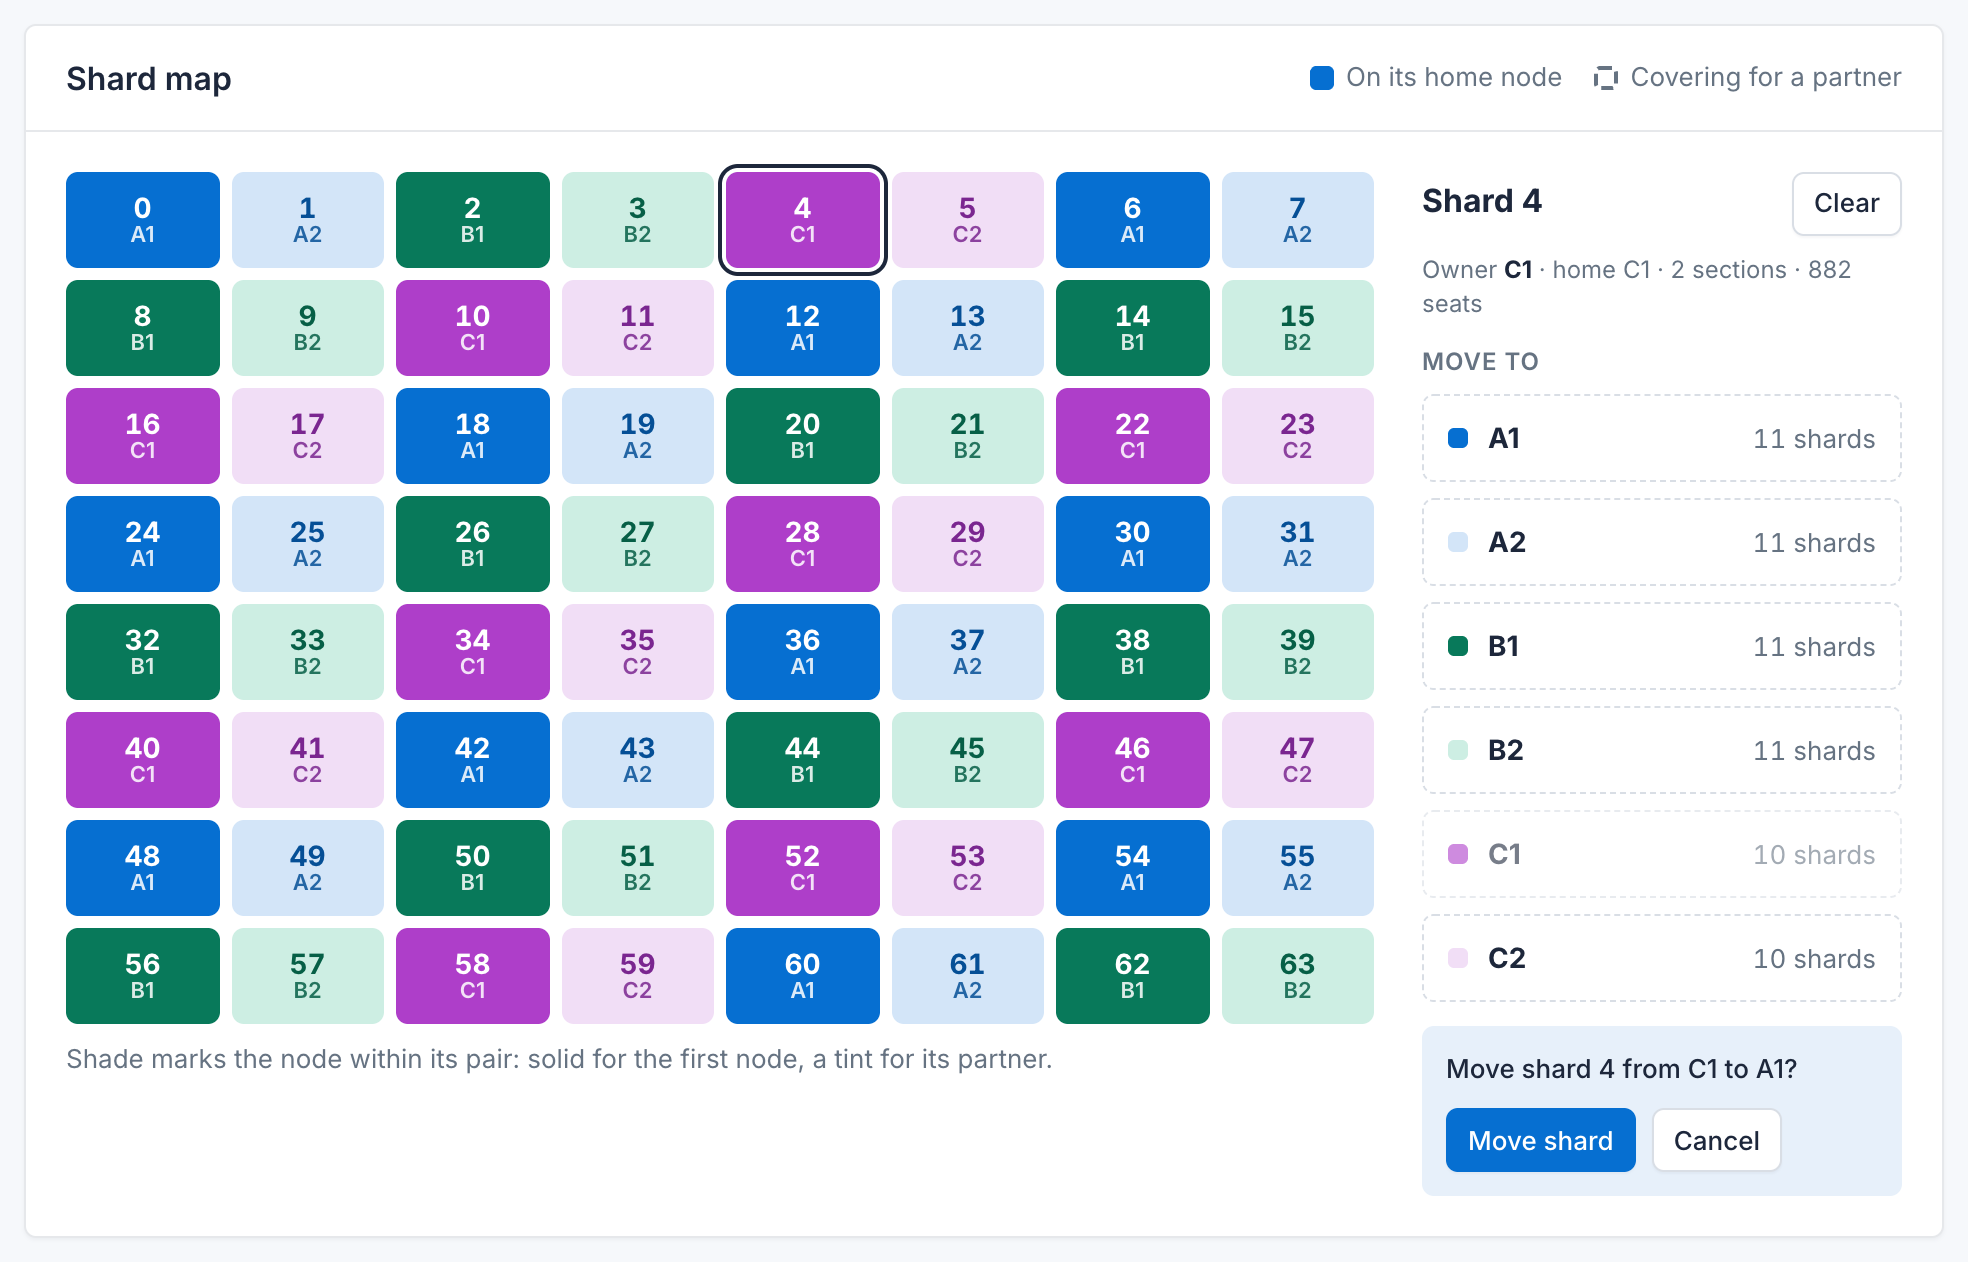
All 64 shards, colored by owner. Select or drag a shard onto any node and confirm the move inline.
Node controls
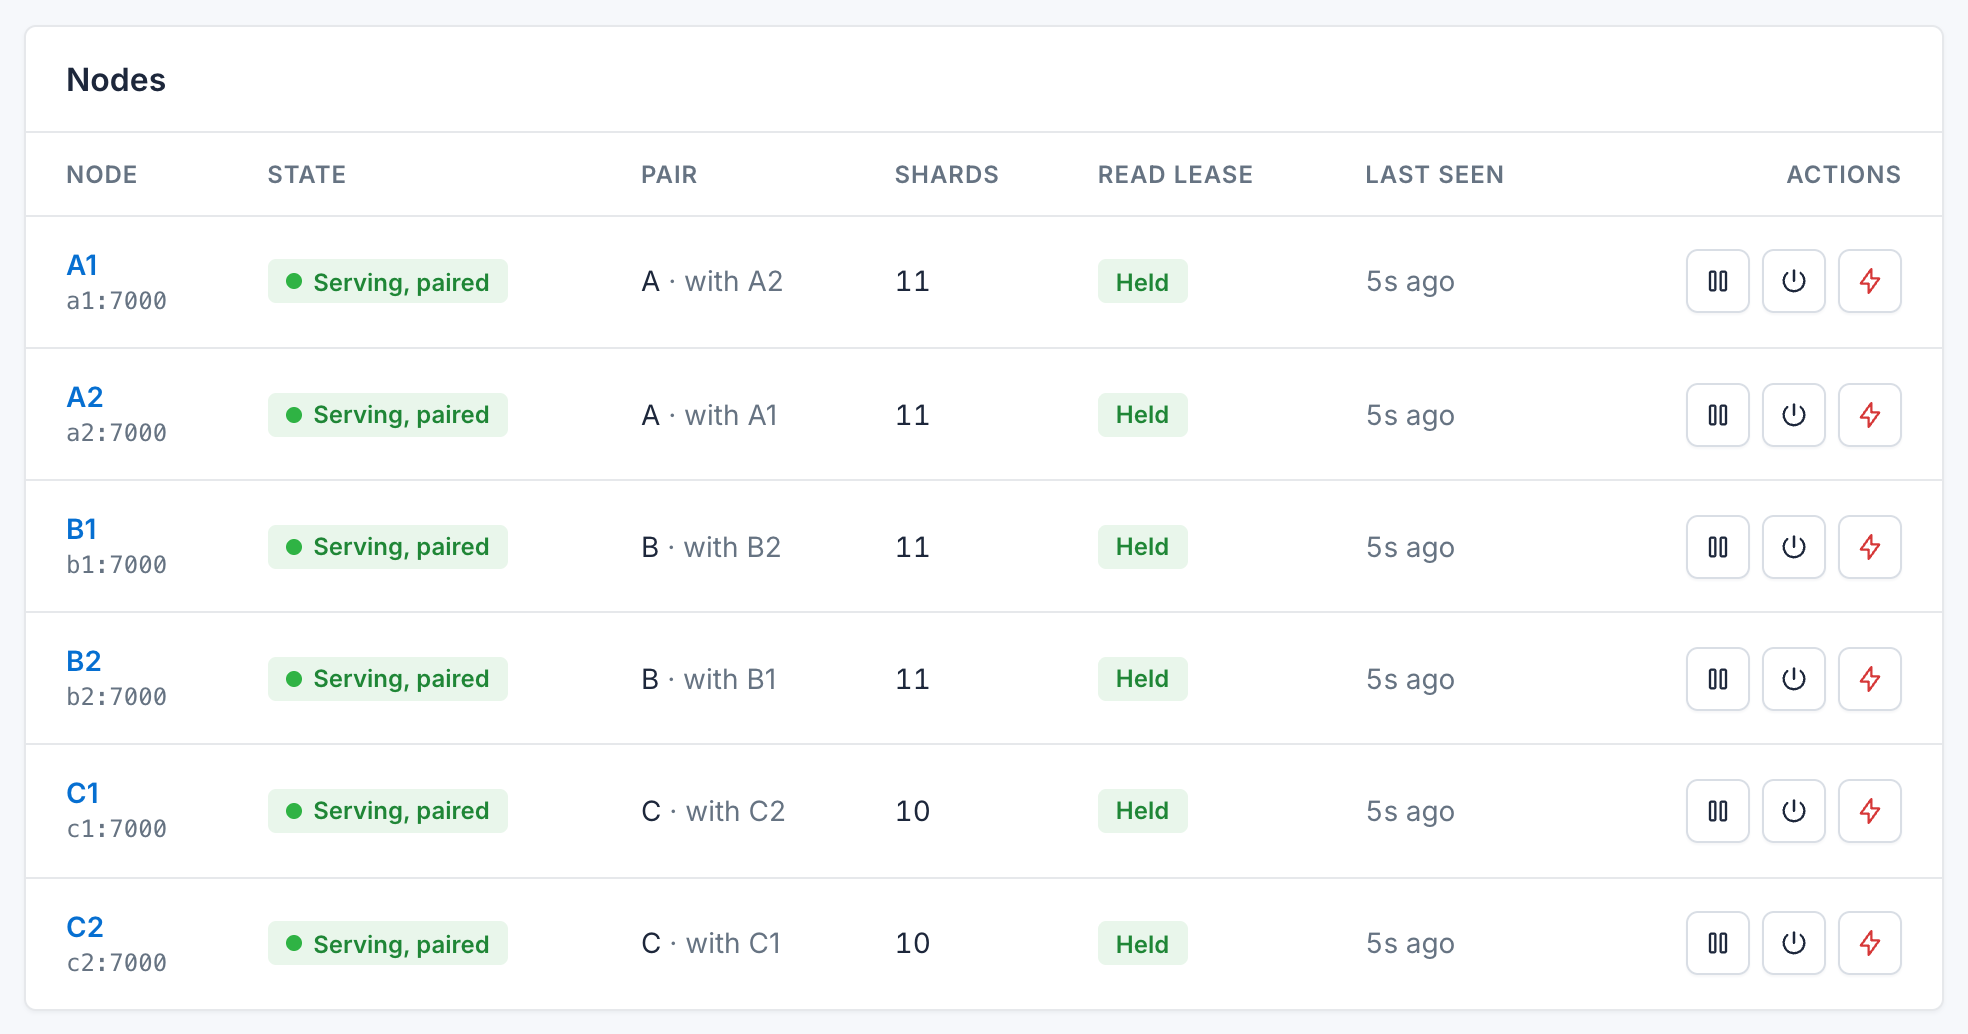
Every node's state, pair, shards, read lease and last heartbeat, with one-click pause, disable and crash actions.
Fault Injection
Break it on purpose
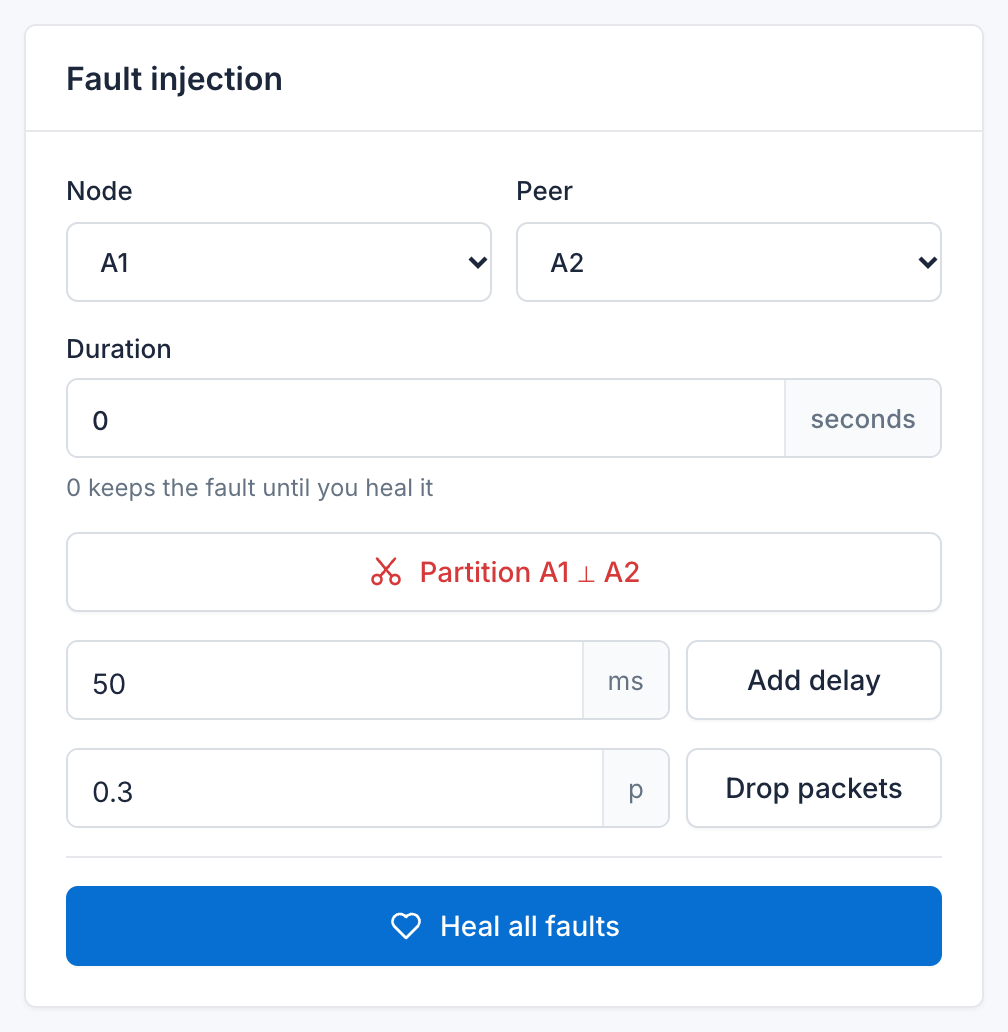
Partition any two nodes, add network delay or packet loss for a set duration, or heal every fault at once. When a pair loses a member, the dashboard flags it as running solo and shows which node holds whose shards until it recovers.
One-click demo scenes
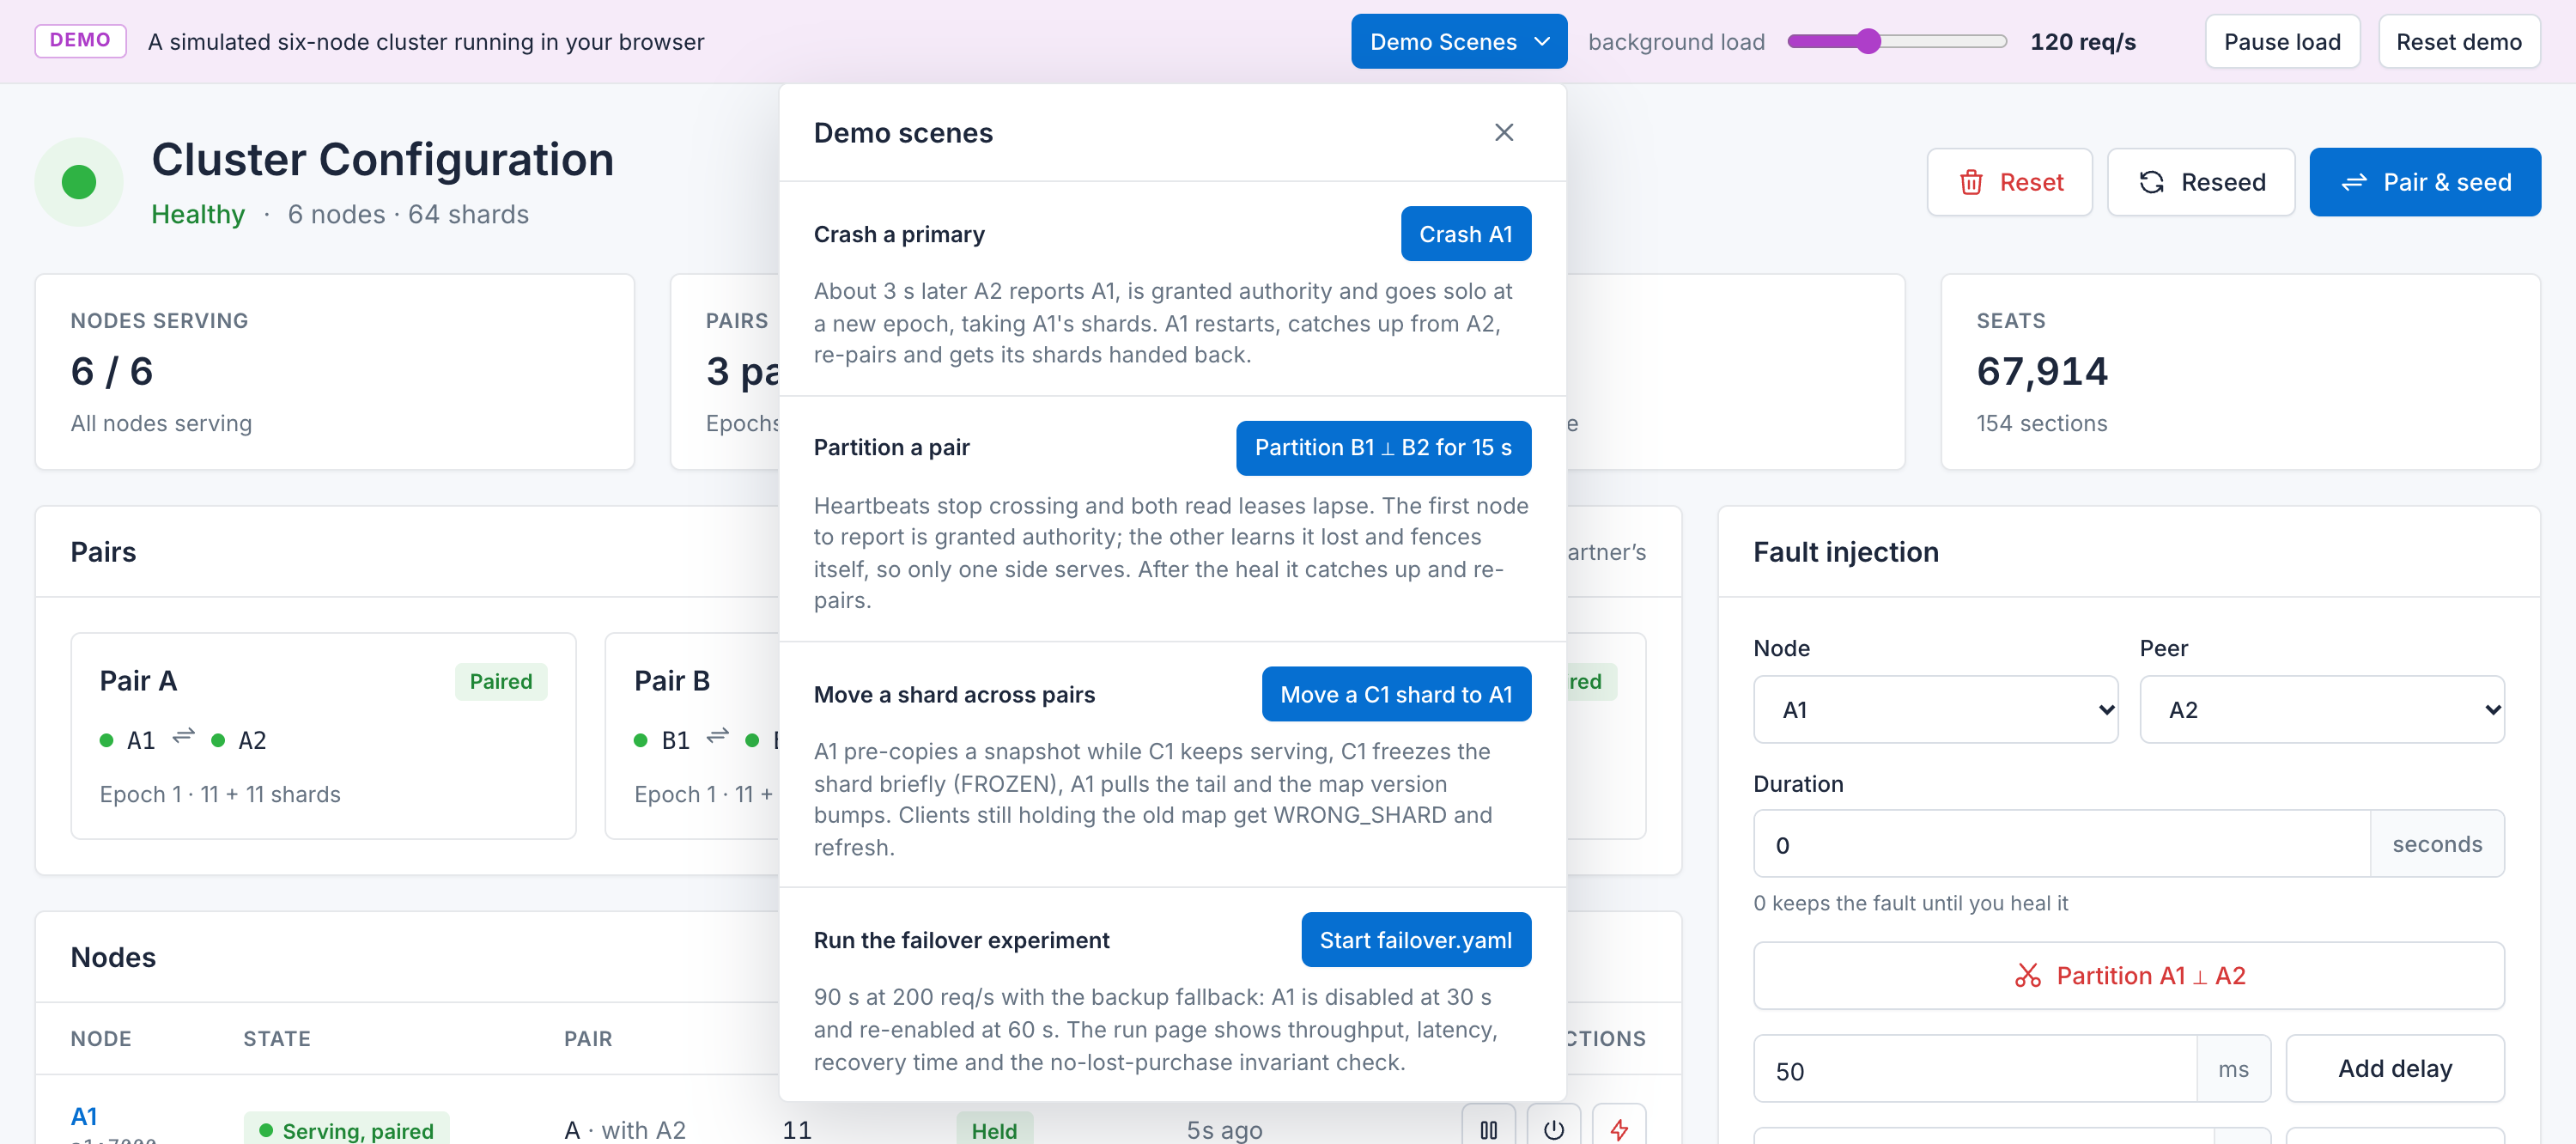
The browser demo comes with ready-made scenarios: crash a primary, partition a pair, move a shard across pairs, or run the failover experiment. Each one describes what to watch for.
Worker Nodes
Drill into any node
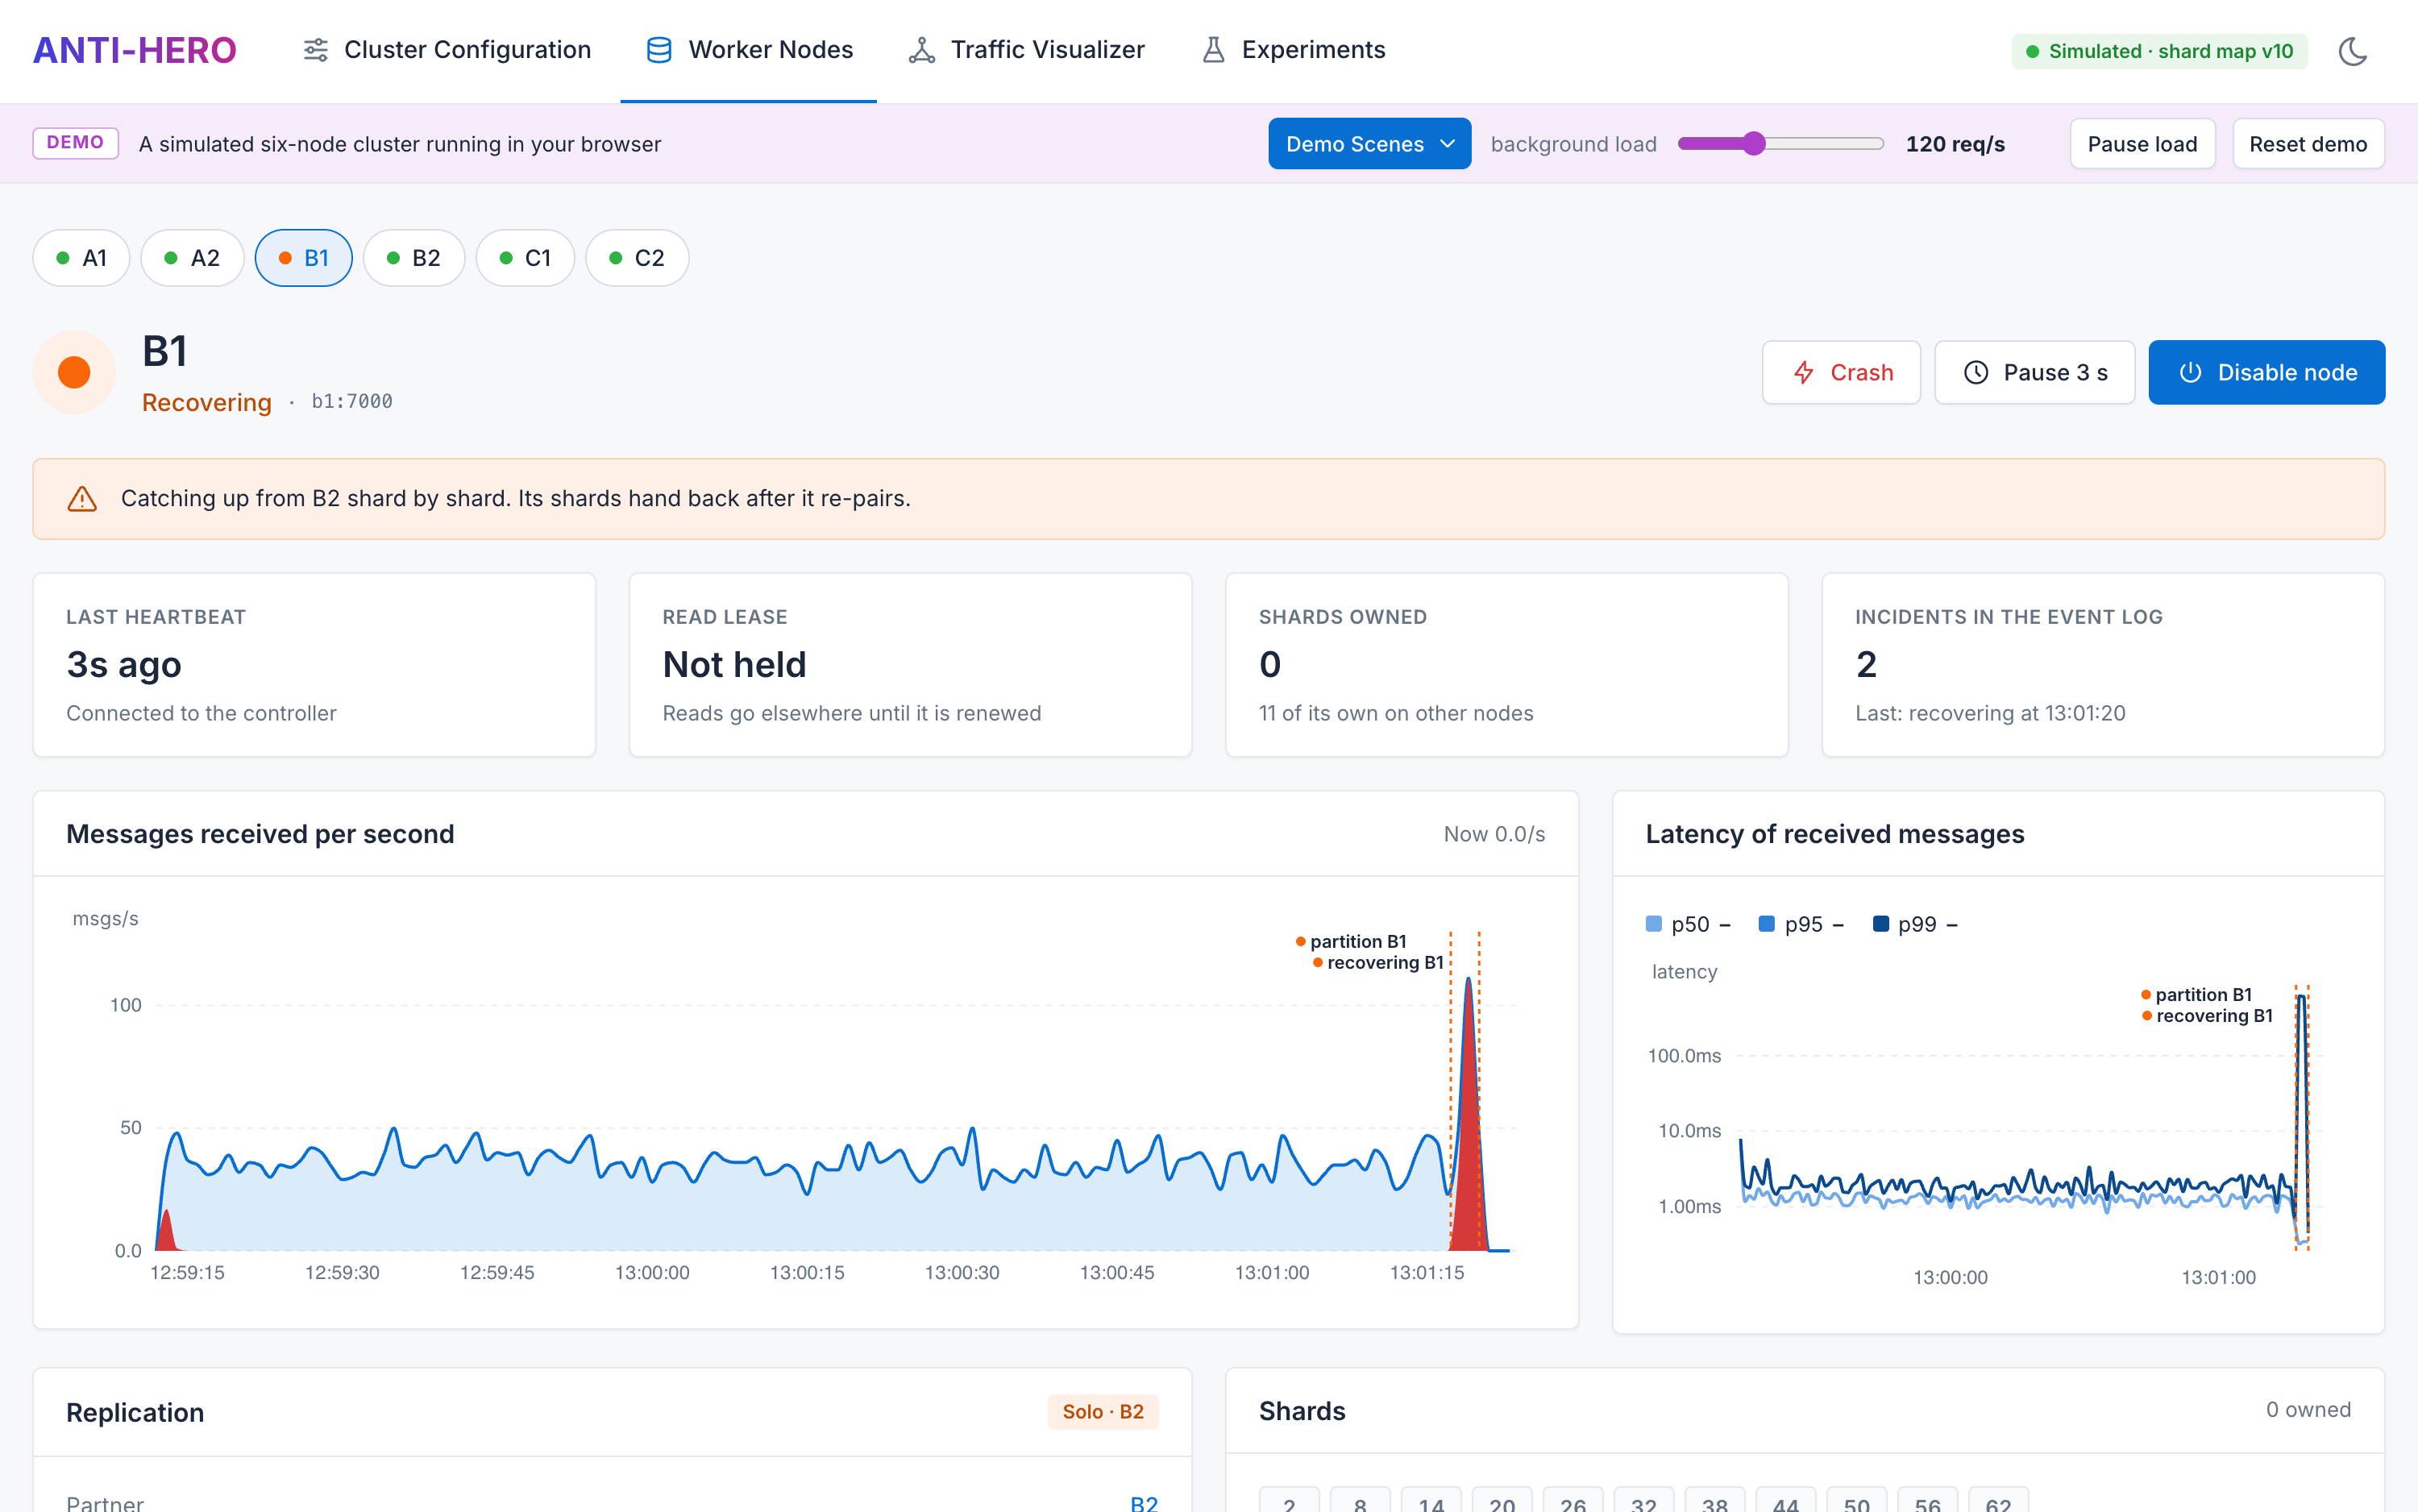
Each node gets its own page with its heartbeat, read lease, owned and covering shards, and charts of the traffic it receives, with its own events marked. Alerts explain what the node is doing, like catching up from its partner after a partition.
Experiments & Replay
Repeatable experiments with correctness checks
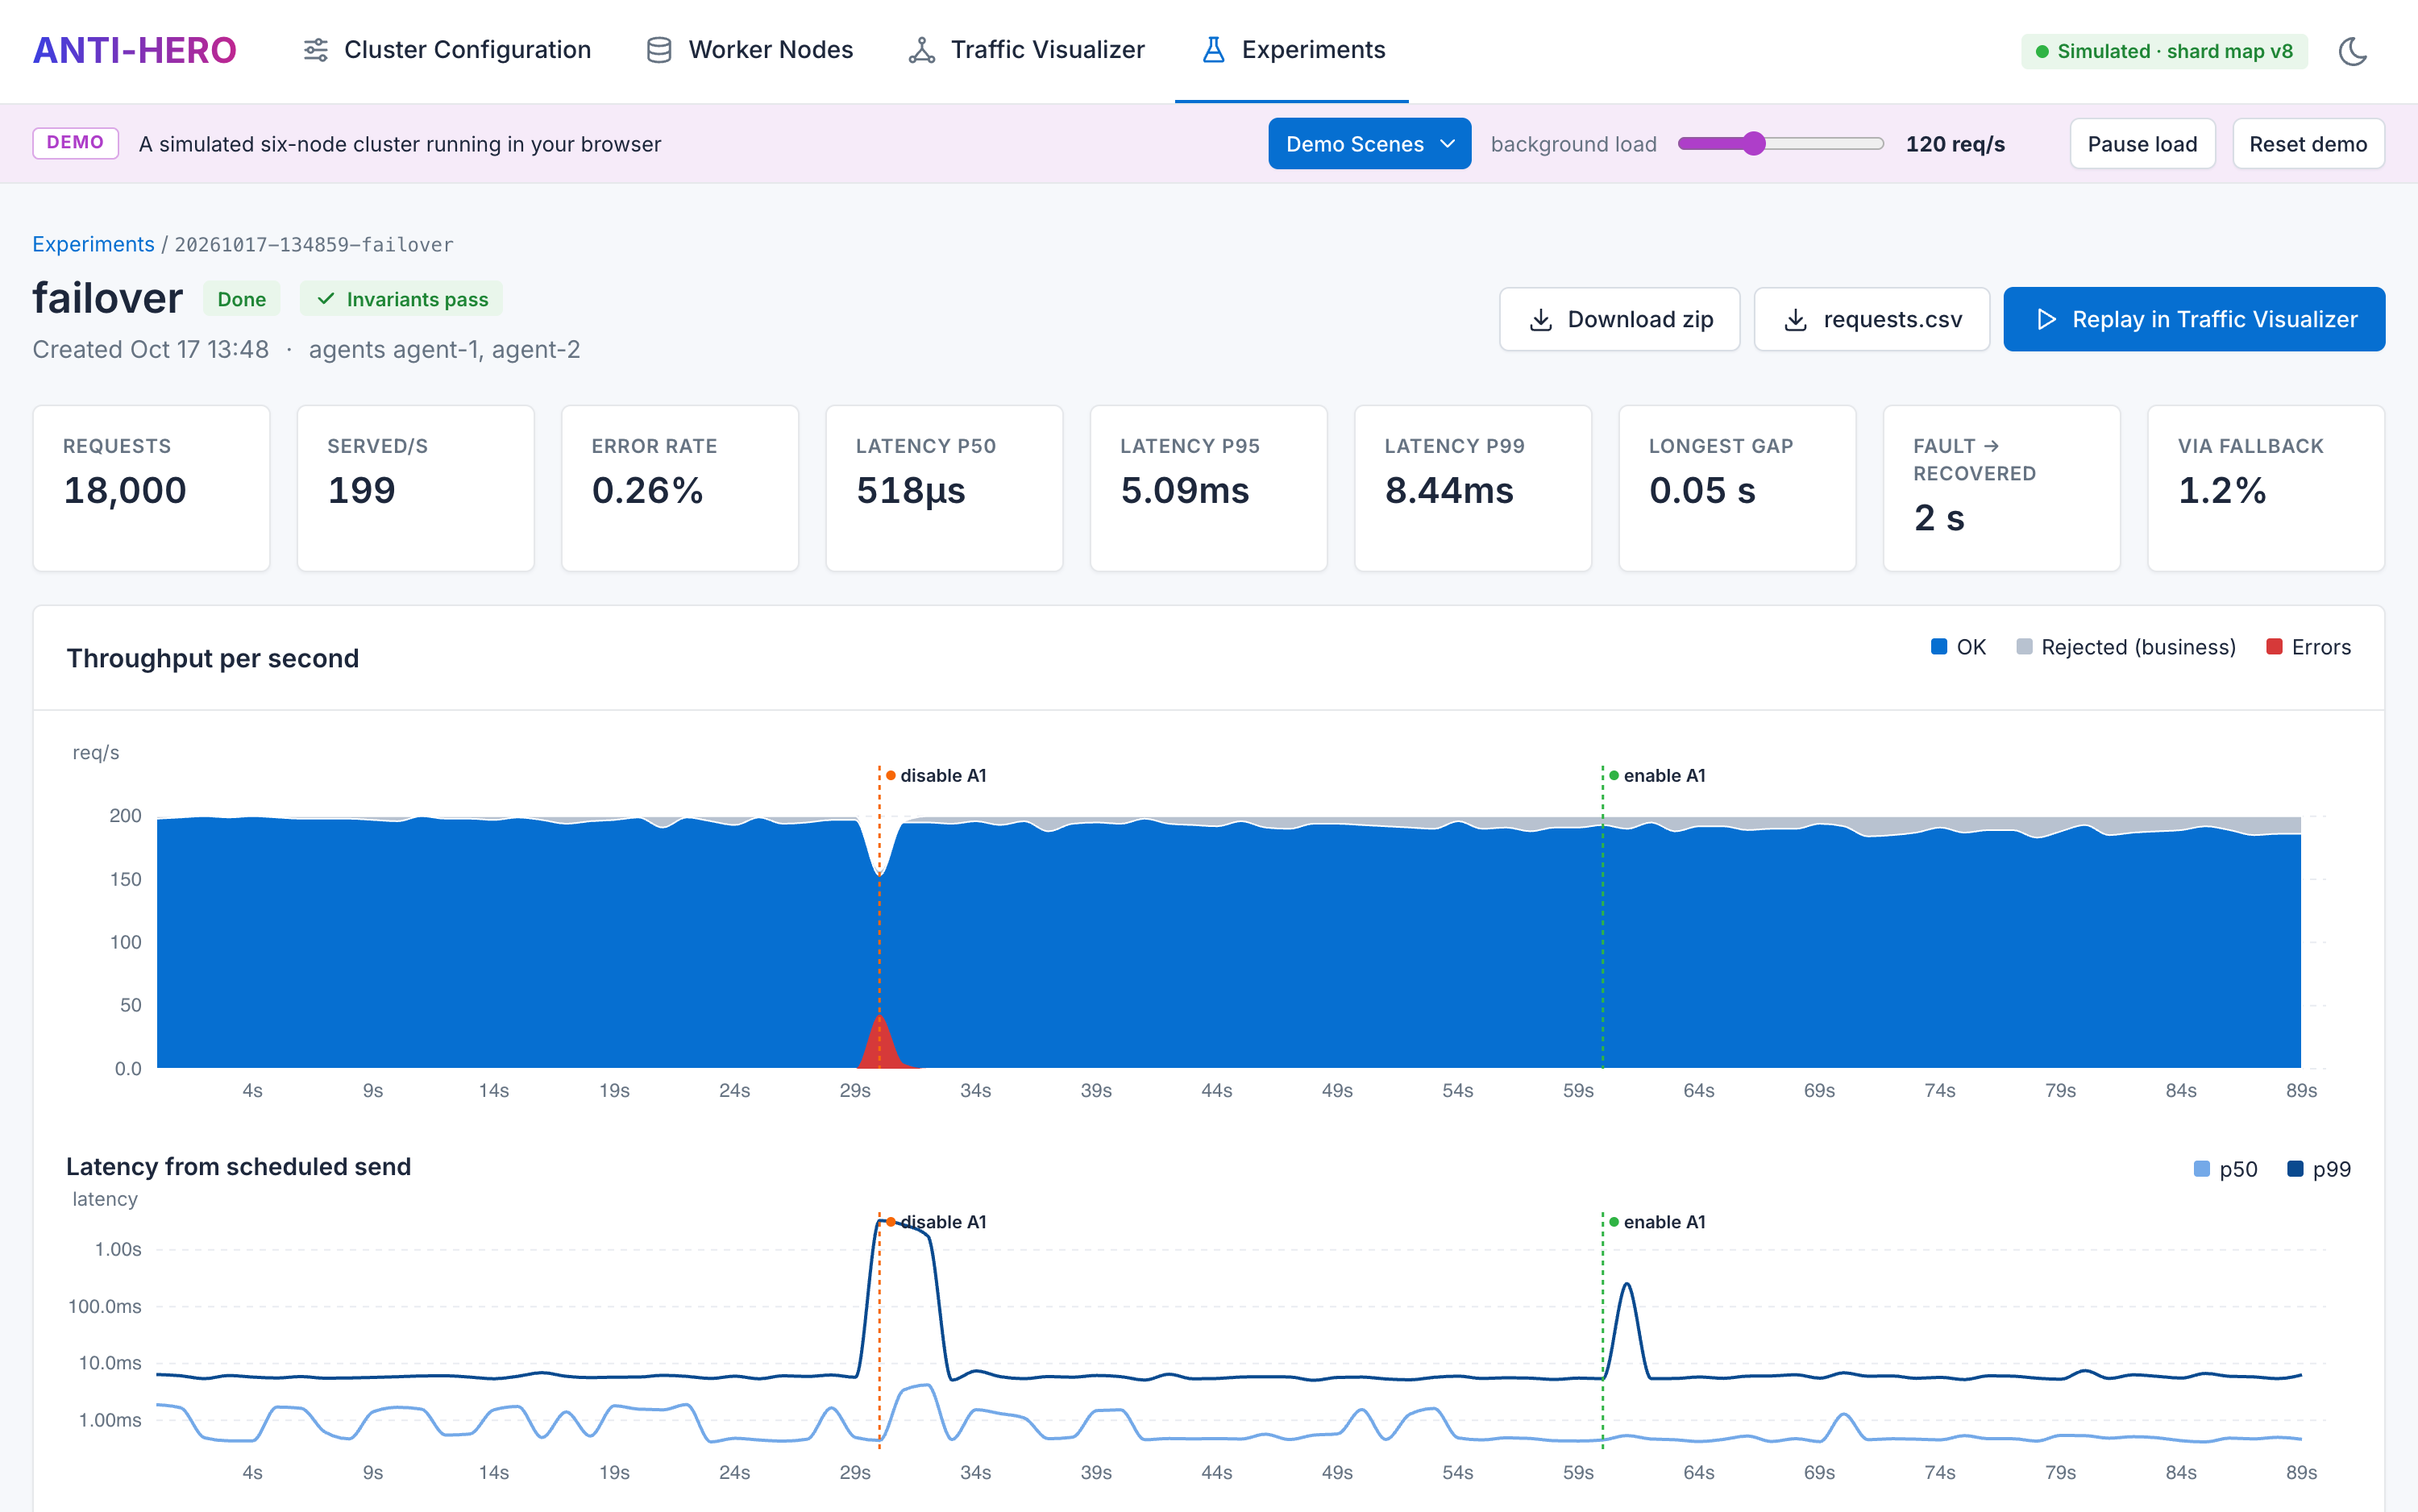
Experiments are YAML specs describing load, request mix and scheduled faults. Each run reports throughput, latency, recovery time and how much traffic the backups served, then checks the invariants: no acknowledged purchase lost and no seat sold twice.
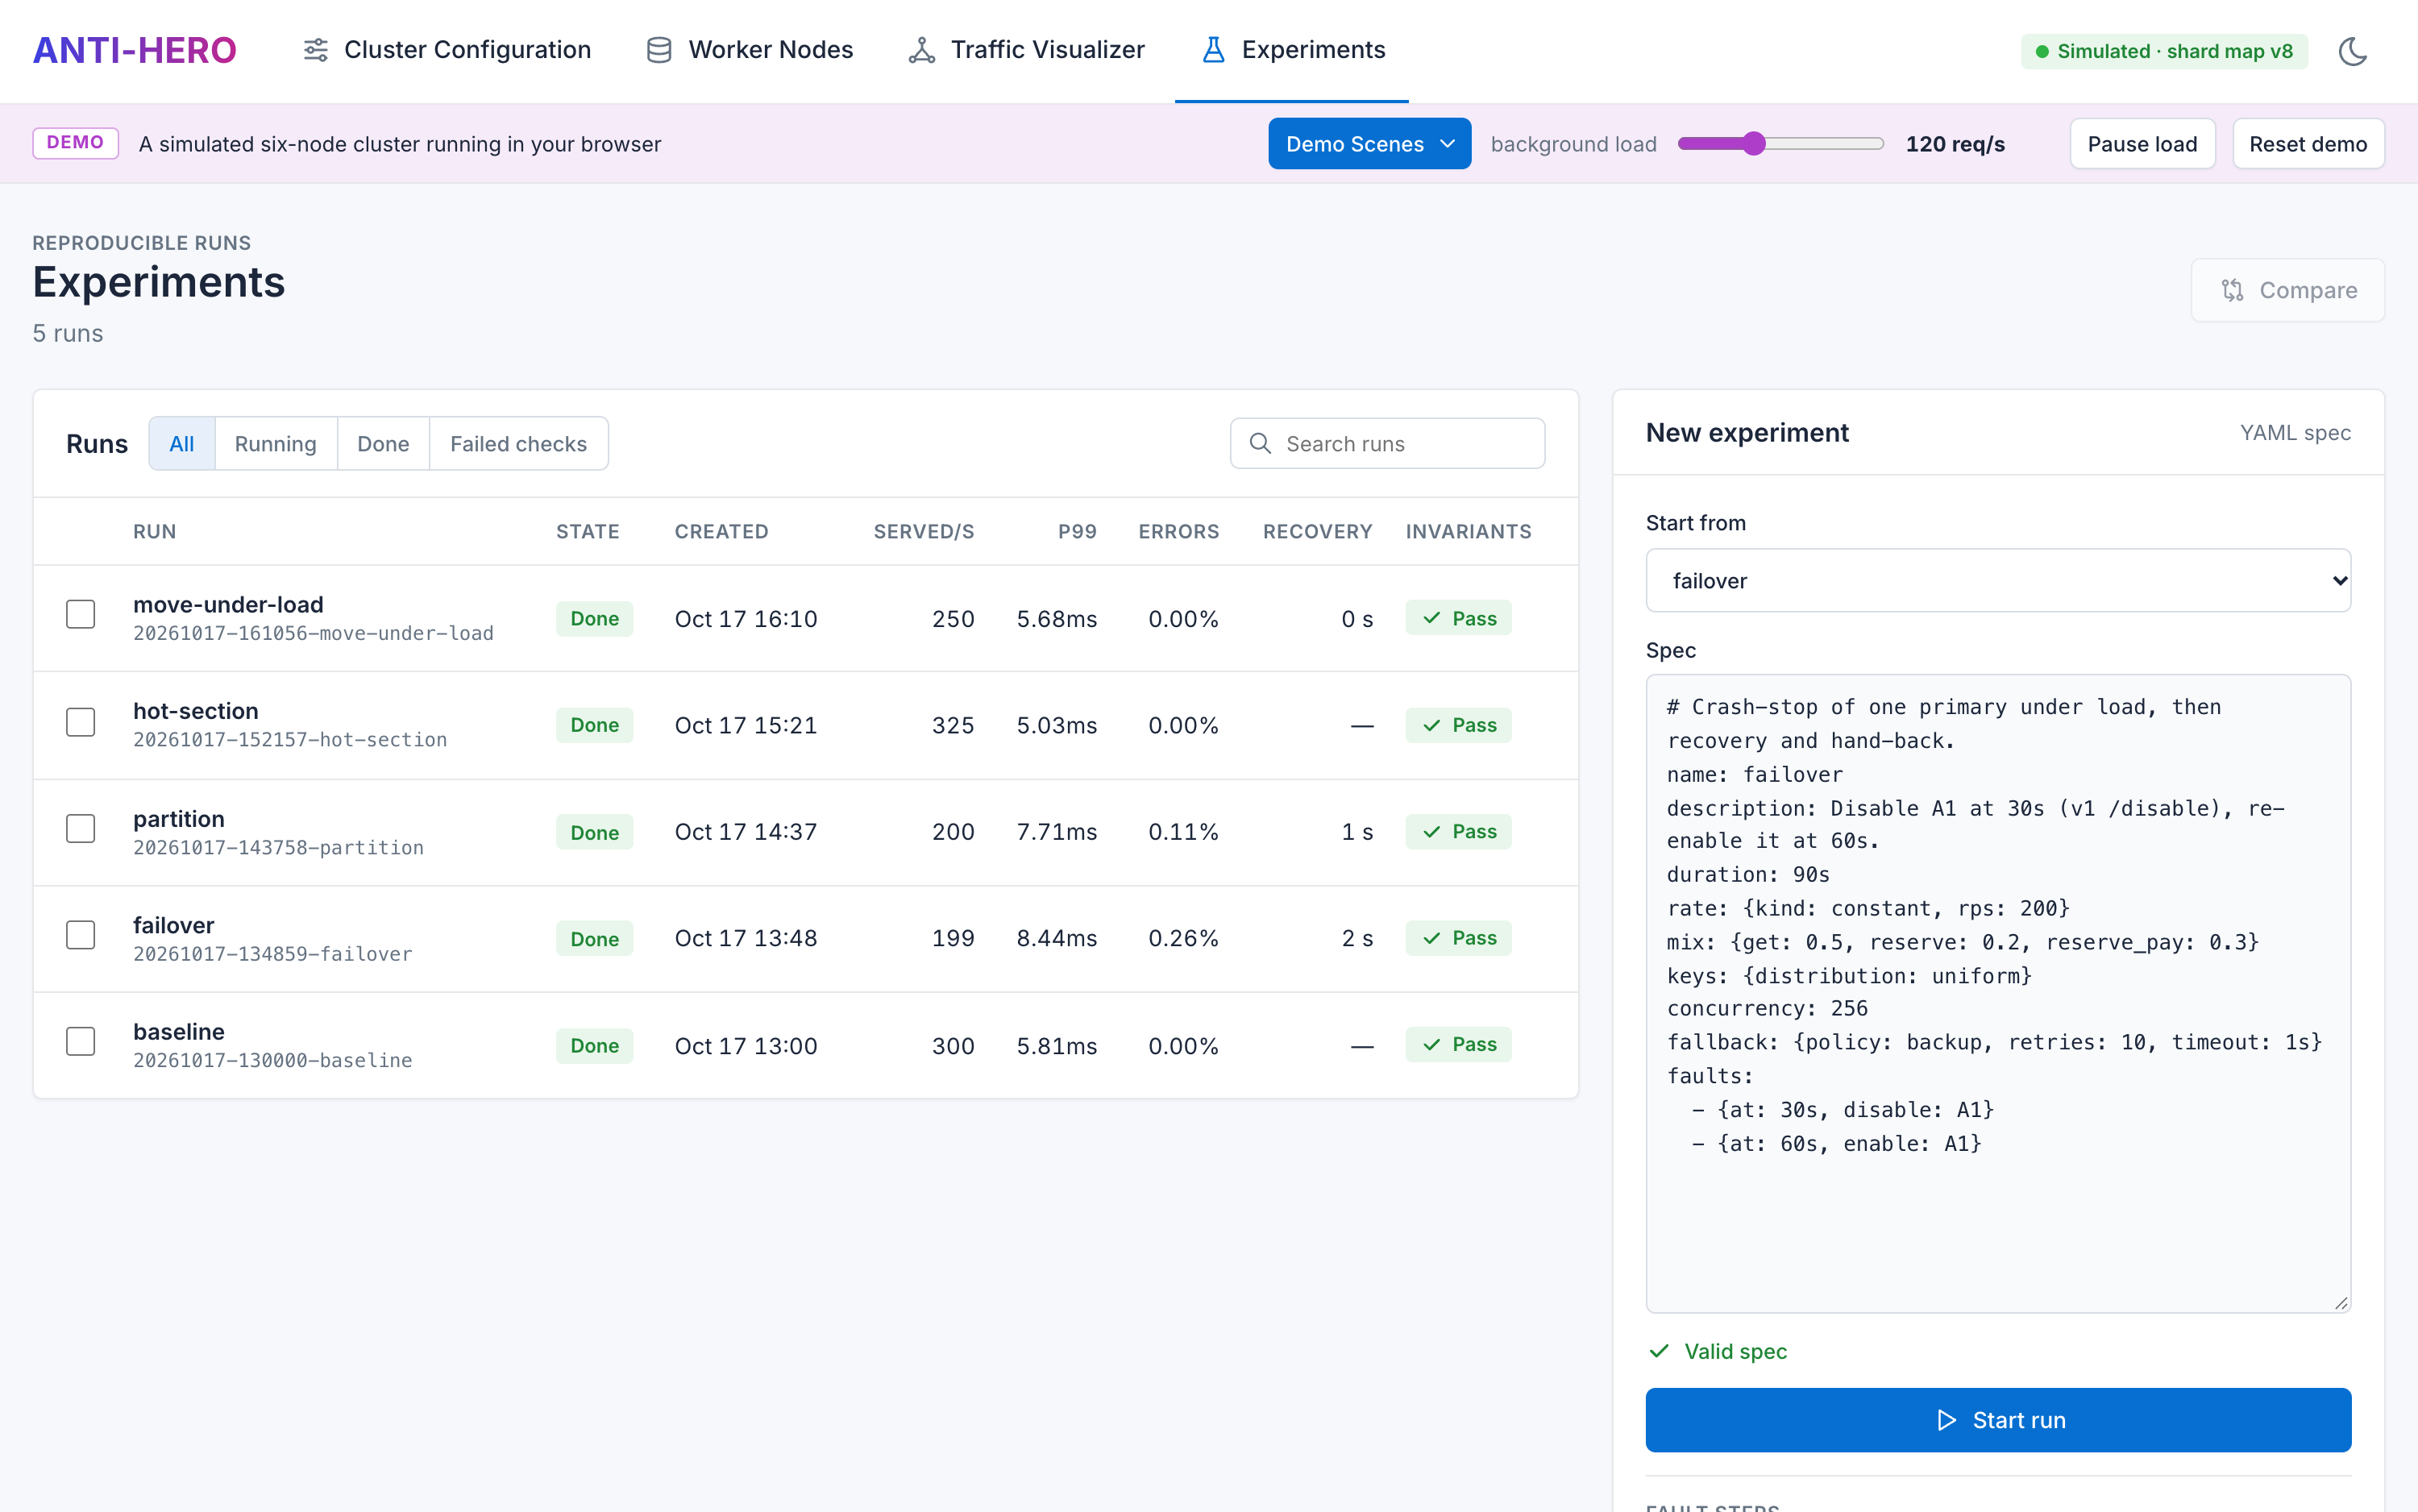
Write and launch runs
Start from an example spec, get live validation as you type, and filter or search past runs.
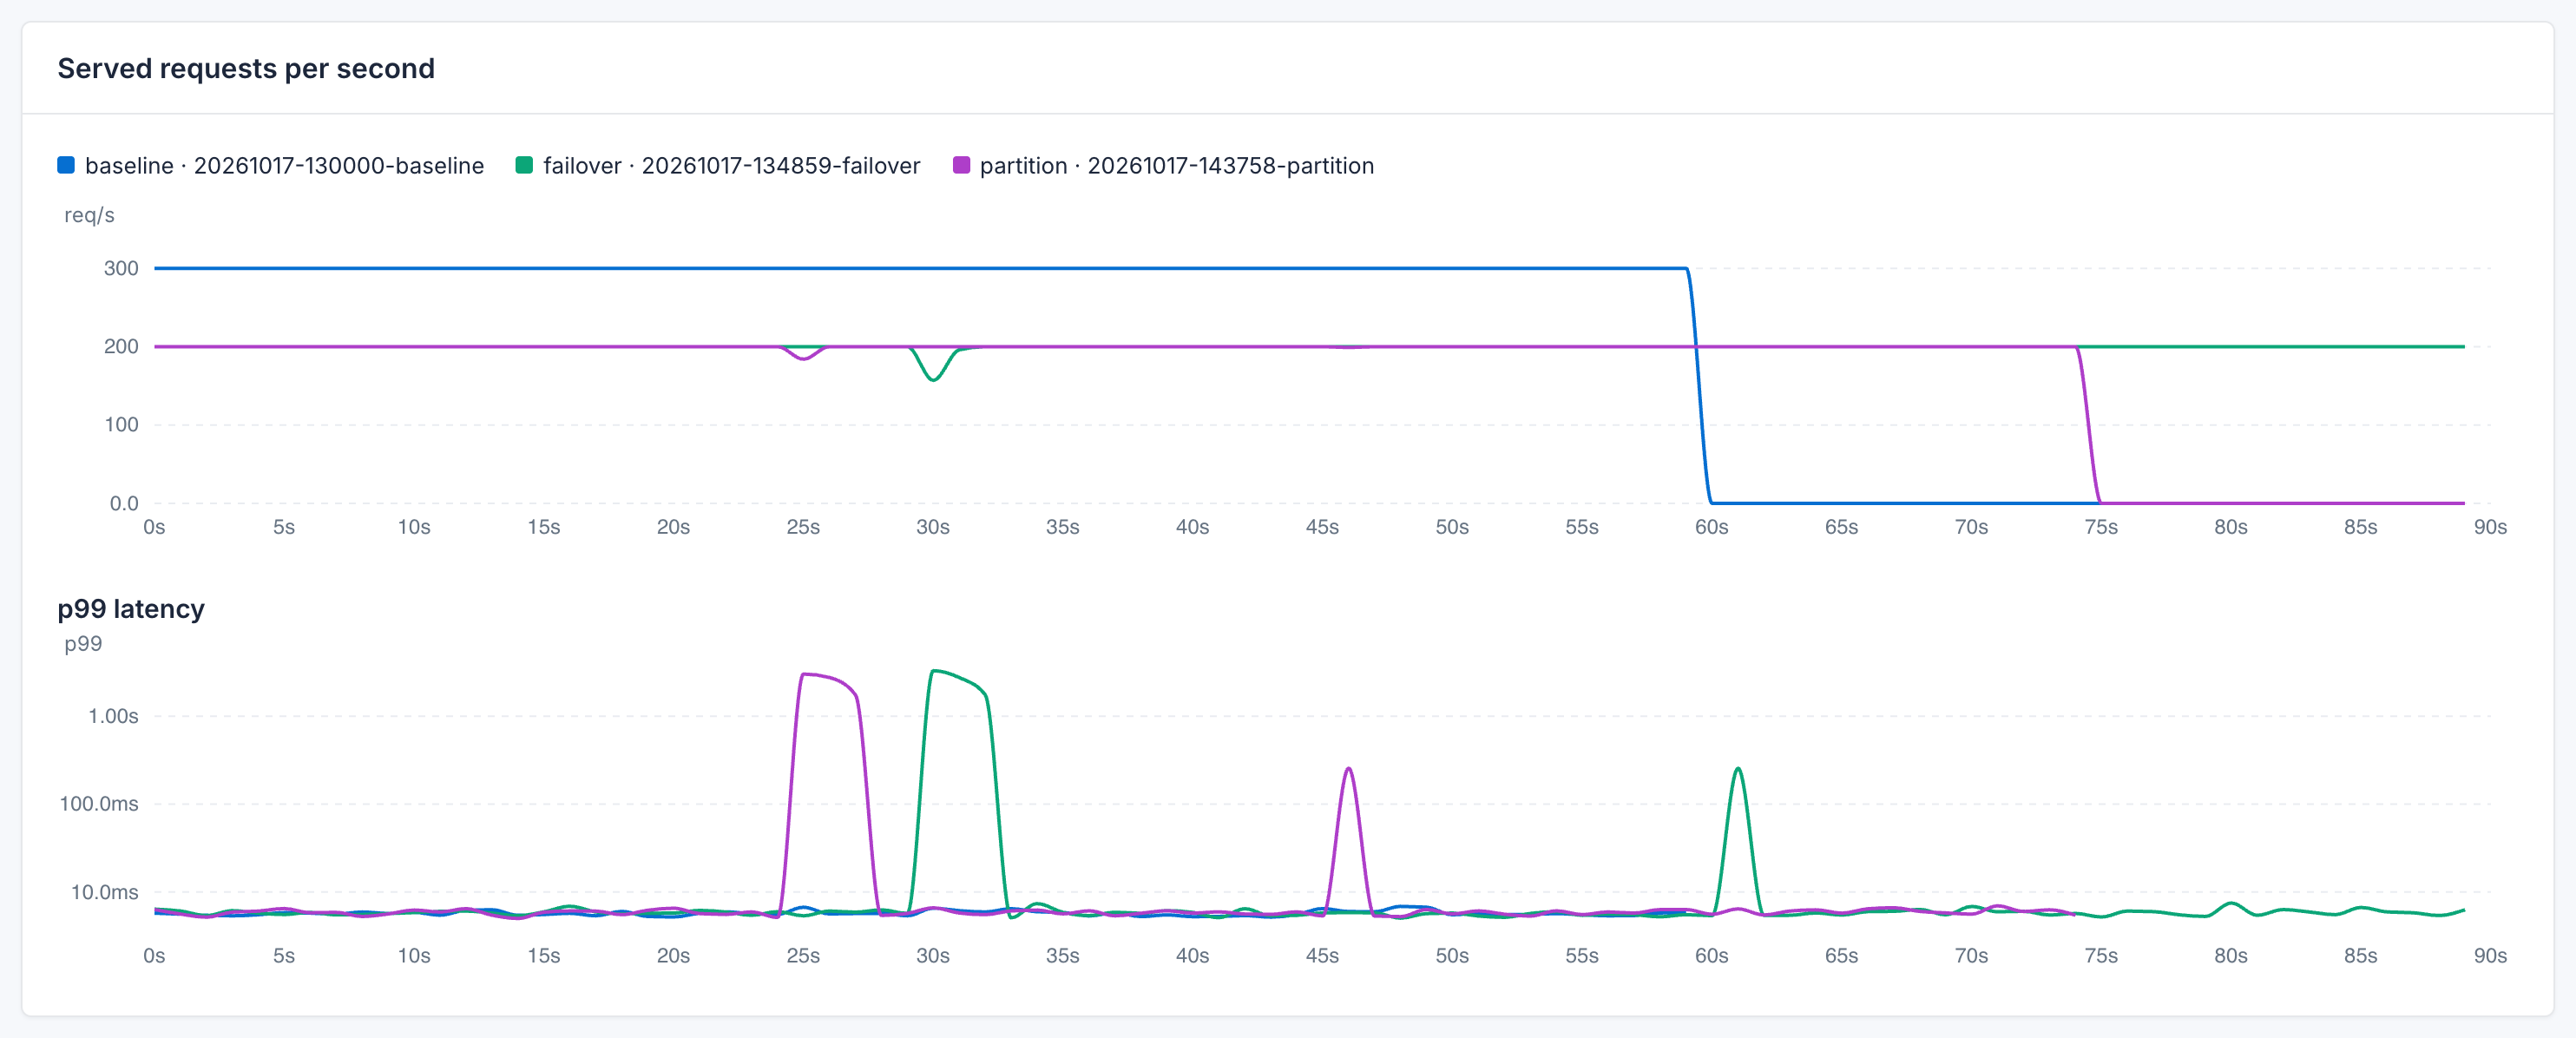
Compare runs
Overlay up to four runs to compare served throughput and p99 latency side by side.
What technologies are used?
The dashboard is a React 19 and TypeScript single-page app built with Vite. The 3D view uses Three.js through React Three Fiber, and the charts are hand-written with D3.js. TanStack Query handles REST data and Zustand holds client state, while live frames arrive over a single WebSocket. On the server, a FastAPI gateway on the Python asyncio controller bridges the browser to the gRPC cluster, and the dashboard's API types are generated from its OpenAPI schema.
How is the data stored?
Each storage node keeps its state in memory and writes it through to an embedded SQLite database (WAL mode with group commit), replacing the per-node PostgreSQL databases of the original. The telemetry hub records per-second frames to Parquet files, which power replay and post-run analysis.
What changed from the original ANTI-HERO?
Version 2 is a ground-up rewrite. REST between components became gRPC with streaming, gunicorn workers became one asyncio process per node, and timestamp heartbeats became epochs, sequence numbers and read leases. Fault injection grew from disabling a node to drops, delays, partitions, pauses and crashes, and the web view was rebuilt from scratch on a new telemetry hub.
How does the demo run without a backend?
The demo build swaps the network transport for a discrete-event simulation of the controller, six nodes and two load agents running in the browser, with the example experiments simulated in a Web Worker. It ships as a static site served by Nginx, and CI checks that none of the demo code ends up in the real build.
Take it for a spin.
The live demo runs a simulated six-node cluster entirely in your browser. Crash nodes, partition pairs and run experiments, no setup required.
Launch Live Demo